
Executive Insights
In this article, you'll learn how to access and customize the Executive Report to view business impact metrics, performance trends, and adoption insights across your AI Agents and Agent Assist deployments.
Before you start
You must be an Owner or Admin in your Enjo workspace
Your workspace must have active AI Agents or Agent Assist instances with conversations from the past 30+ days
Allow 1–2 minutes to explore the full report and customize settings
How it works
The Executive Report is a high-level ROI dashboard that consolidates:
Business Impact — Cost savings, time saved, and net savings estimates
AI Agent Performance — Resolution rate, acceleration rate, and user effectiveness
Productivity Metrics — Questions asked, AI answers generated, summaries created, knowledge base entries generated
Adoption Insights — Conversation volume, active channels, active users, knowledge sources indexed
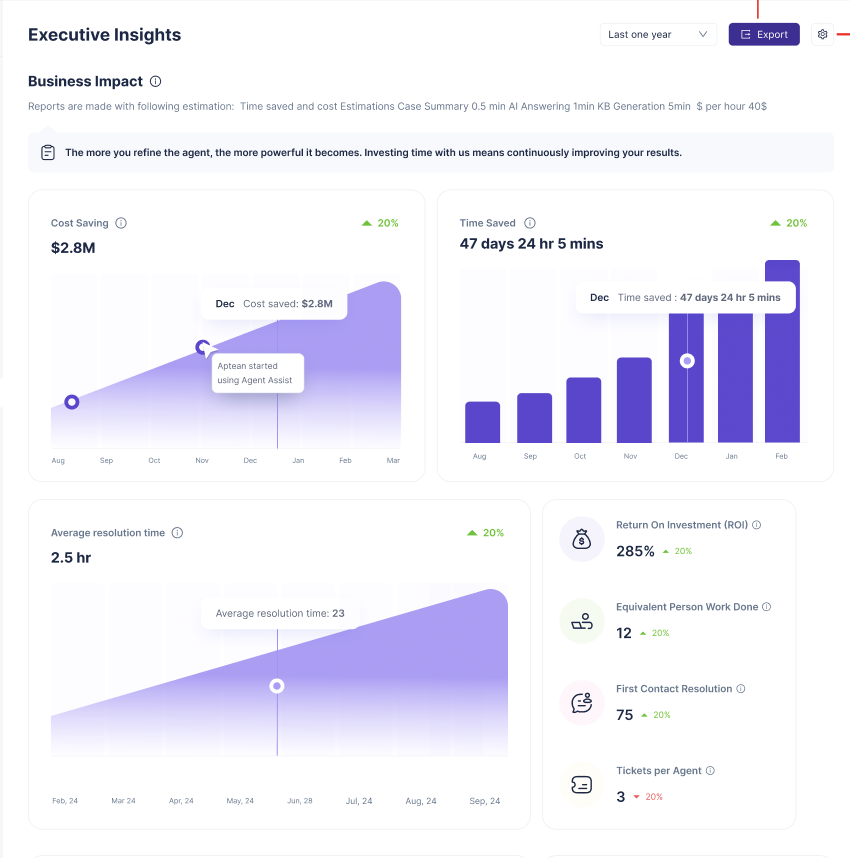
All metrics are filtered by date range and can be scoped to specific AI Agents or Agent Assist instances.
Access the Executive Report
Go to Insights > Reports > Executive. The Executive Report opens with default settings: last one month, all AI Agents and Agent Assist selected.
Access the Executive Report
Go to Insights > Reports > Executive. The Executive Report opens with default settings: last one month, all AI Agents and Agent Assist selected.
Customize filters and modules
In the Settings panel on the right, select which modules to display:
AI Agent — Check this to include AI Agent metrics (optional if only viewing Agent Assist)
Agent Assist — Check this to include Agent Assist metrics (optional if only viewing AI Agents)
All Agents or All Agent Assists — Select this to view all instances, or select specific agents individually
Choose your time window from the Time Period dropdown:
One month
Three months
Six months
(Optional) To hide specific metrics that aren't relevant to your analysis, scroll down and toggle off sections like "AI Question Generation" or "Summary Generation."
Click Save to apply your filters.
💡 Tip: Save multiple report configurations by exporting as PDF. Go to Last One Month > Export PDF at the top right to download a snapshot.
Understand Business Impact metrics
The Business Impact card at the top displays your organization's estimated return on investment:
Metric | What it shows |
|---|---|
Cost Saving | Estimated reduction in human effort cost. Calculated based on your deflection rate (conversations handled by AI vs. escalated to humans), hourly wage per employee, and volume of conversations. |
Time Saved | Total hours and minutes saved across all AI-handled conversations. Based on average resolution time per conversation and number of resolved conversations. |
Net Savings | Cost savings minus your monthly Enjo platform cost. Positive net savings indicate your AI investment is paying for itself. |
Equivalent Person-Work Done | Number of full-time employees replaced by AI work. Calculated as: Total Time Saved ÷ 1,880 (standard annual FTE hours). |
ℹ️ Note: All estimates use the default assumptions you set in Shared settings. Adjust hourly wage and platform cost to reflect your actual labor rates and subscription plan.
Customize Business Impact assumptions
The Shared tab in Settings lets you adjust the assumptions used to calculate cost and time savings:
In the Settings panel, click the Shared tab.
Update these fields:
Hourly wage per employee — Your average fully loaded hourly cost (salary + benefits)
Monthly platform cost — Your Enjo subscription fee (e.g., $295 for Standard plan)
Click Save.
The Executive Report recalculates all metrics immediately using your new assumptions.
⚠️ Warning: These are organizational defaults. Ensure your hourly wage reflects your full labor cost, including benefits and overhead, for accurate ROI calculations.
Review AI Agent Performance metrics
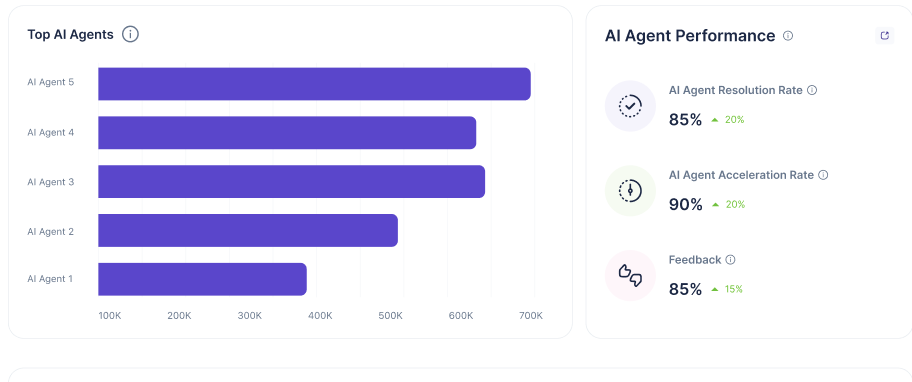
The AI Agent Performance card displays:
Metric | What it means |
|---|---|
Deflection Rate | Percentage of conversations the AI Agent resolved without human escalation. Higher is better. |
Acceleration Rate | Percentage of escalated conversations where the AI provided a draft answer that the human agent accepted or refined (vs. writing from scratch). |
Usefulness | Aggregate signal indicating how often users found the AI's suggestions helpful. Based on feedback signals in your account. |
Select specific AI Agents from the dropdown or view all agents combined. The metrics update dynamically based on your selected time period and filters.
Review productivity metrics
The Productivity section shows:
Metric | What it measures |
|---|---|
Questions Asked | Total number of times customers or agents asked the AI questions in your configured channels. |
AI Answers Generated | Total AI-generated responses. One answer per customer question. |
Summaries Generated | (Agent Assist only) Number of conversation summaries auto-generated to assist human agents. |
KB Generated | Number of knowledge base entries auto-drafted from resolved conversations. Each entry can be refined and published to your Help Center. |
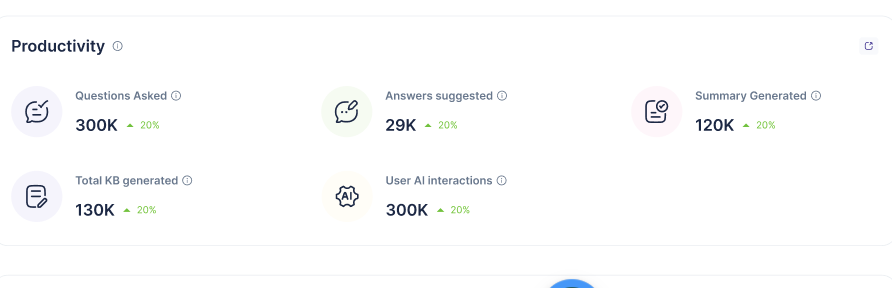
These metrics show adoption velocity—higher numbers indicate your team is actively using AI to deflect and automate work.
Review adoption metrics
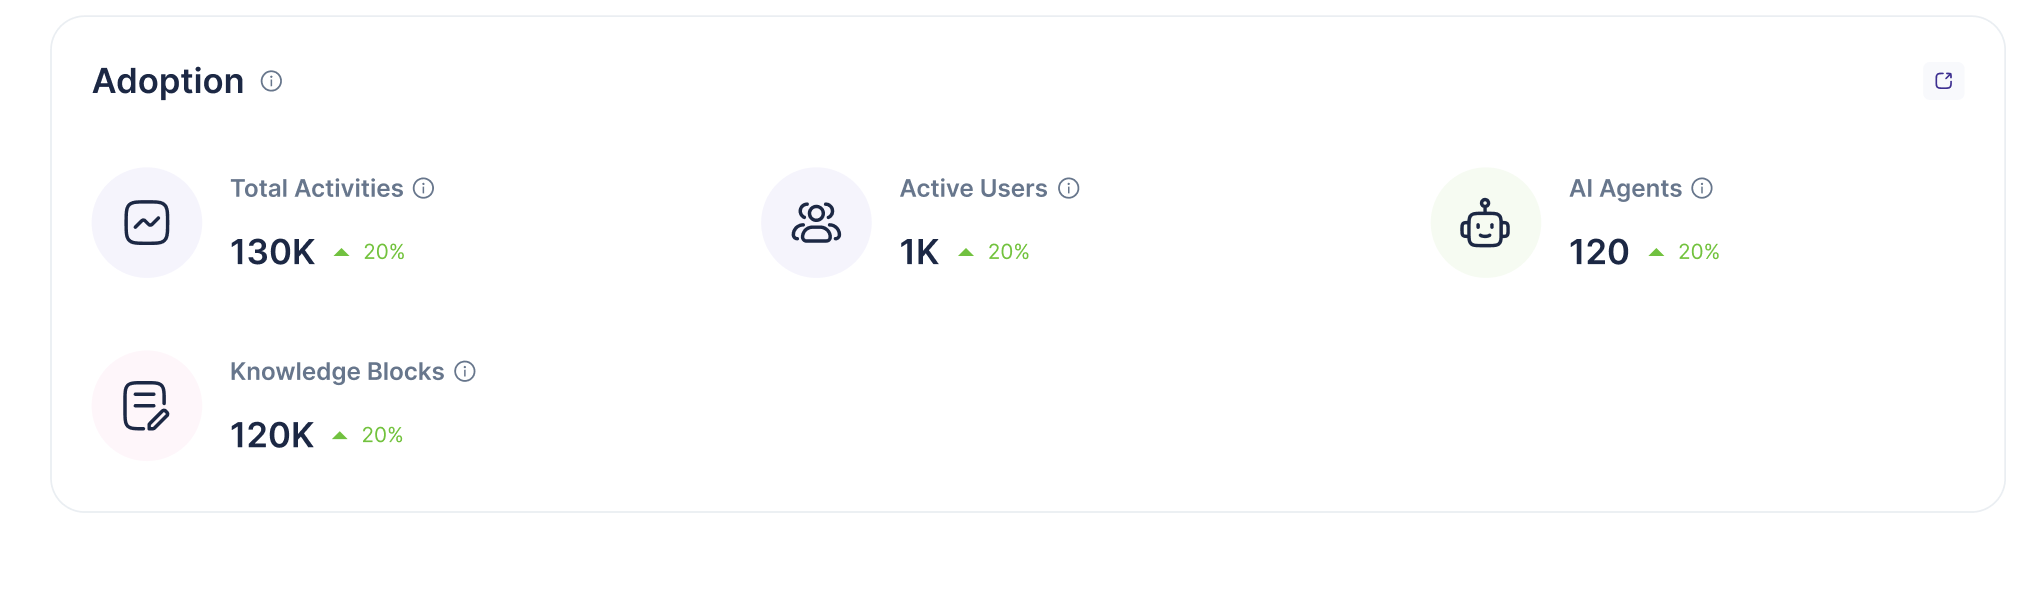
The Adoption section displays:
Metric | What it tracks |
|---|---|
Conversation Volume | Total resolved and unresolved conversations from all configured channels (Slack, Teams, web, API, etc.). |
Channels | Number of distinct conversation channels where your AI Agents or Agent Assist are active. |
Knowledge Blocks | Total knowledge sources (Confluence, Google Drive, Jira tickets, etc.) indexed and synced to your AI Agents. |
Active Users | Number of unique users who interacted with your AI Agents or used Agent Assist during the selected period. |
Total Activities | All actions performed across the workspace (conversations, escalations, AI suggestions reviewed, etc.). |
Each metric includes a trend delta (percentage change) shown in green (positive trend) or red (declining trend) to help spot growth or adoption dips.
Navigate to detailed performance reports
From the Executive Report, you can drill down into specific analytics:
Click on AI Agent Performance to open the performance overview with granular accuracy metrics.
Click on Adoption to see detailed activity logs and channel-by-channel breakdowns.
Click on Productivity to review specific AI outputs (answers, summaries, KB entries).
Each linked report allows further filtering, data export, and trend analysis.
Export the report
To share the Executive Report with stakeholders:
At the top right, click Export PDF.
Select your date range, modules, and filters.
The PDF includes all visible cards, metrics, and calculations.
💡 Tip: Schedule monthly exports to track ROI trends and build a quarterly business case for AI expansion.
What's next
Performance Overview — View detailed AI Agent and human agent performance metrics
Adoption Overview — Track feature adoption and usage trends across your workspace
Sentiment Analysis — Monitor customer sentiment to identify support friction points
Help Desk Assessment — Find automation opportunities and optimization gaps
Feedback & Engagement — Capture and act on user feedback to improve AI responses