AI Agent Performance Insights
The AI Agent Performance report shows you how effectively your AI Agent is handling requests. You can see what percentage of conversations the agent is resolving on its own, how often users are being escalated to a human agent, and where there are opportunities to improve.
Use this report to track your AI Agent's impact over time, compare performance across multiple agents, and identify gaps in your knowledge base.
Before You Begin
You must have access to Insights in your Enjo workspace.
The AI Agent Performance report is available under Insights > Products > AI Agent.
At least one AI Agent must be configured and actively handling conversations.
Step 1: Navigate to the AI Agent Performance Report
Go to Insights in the left sidebar. Under the Products section, click AI Agent. The page opens on the Performance tab by default.
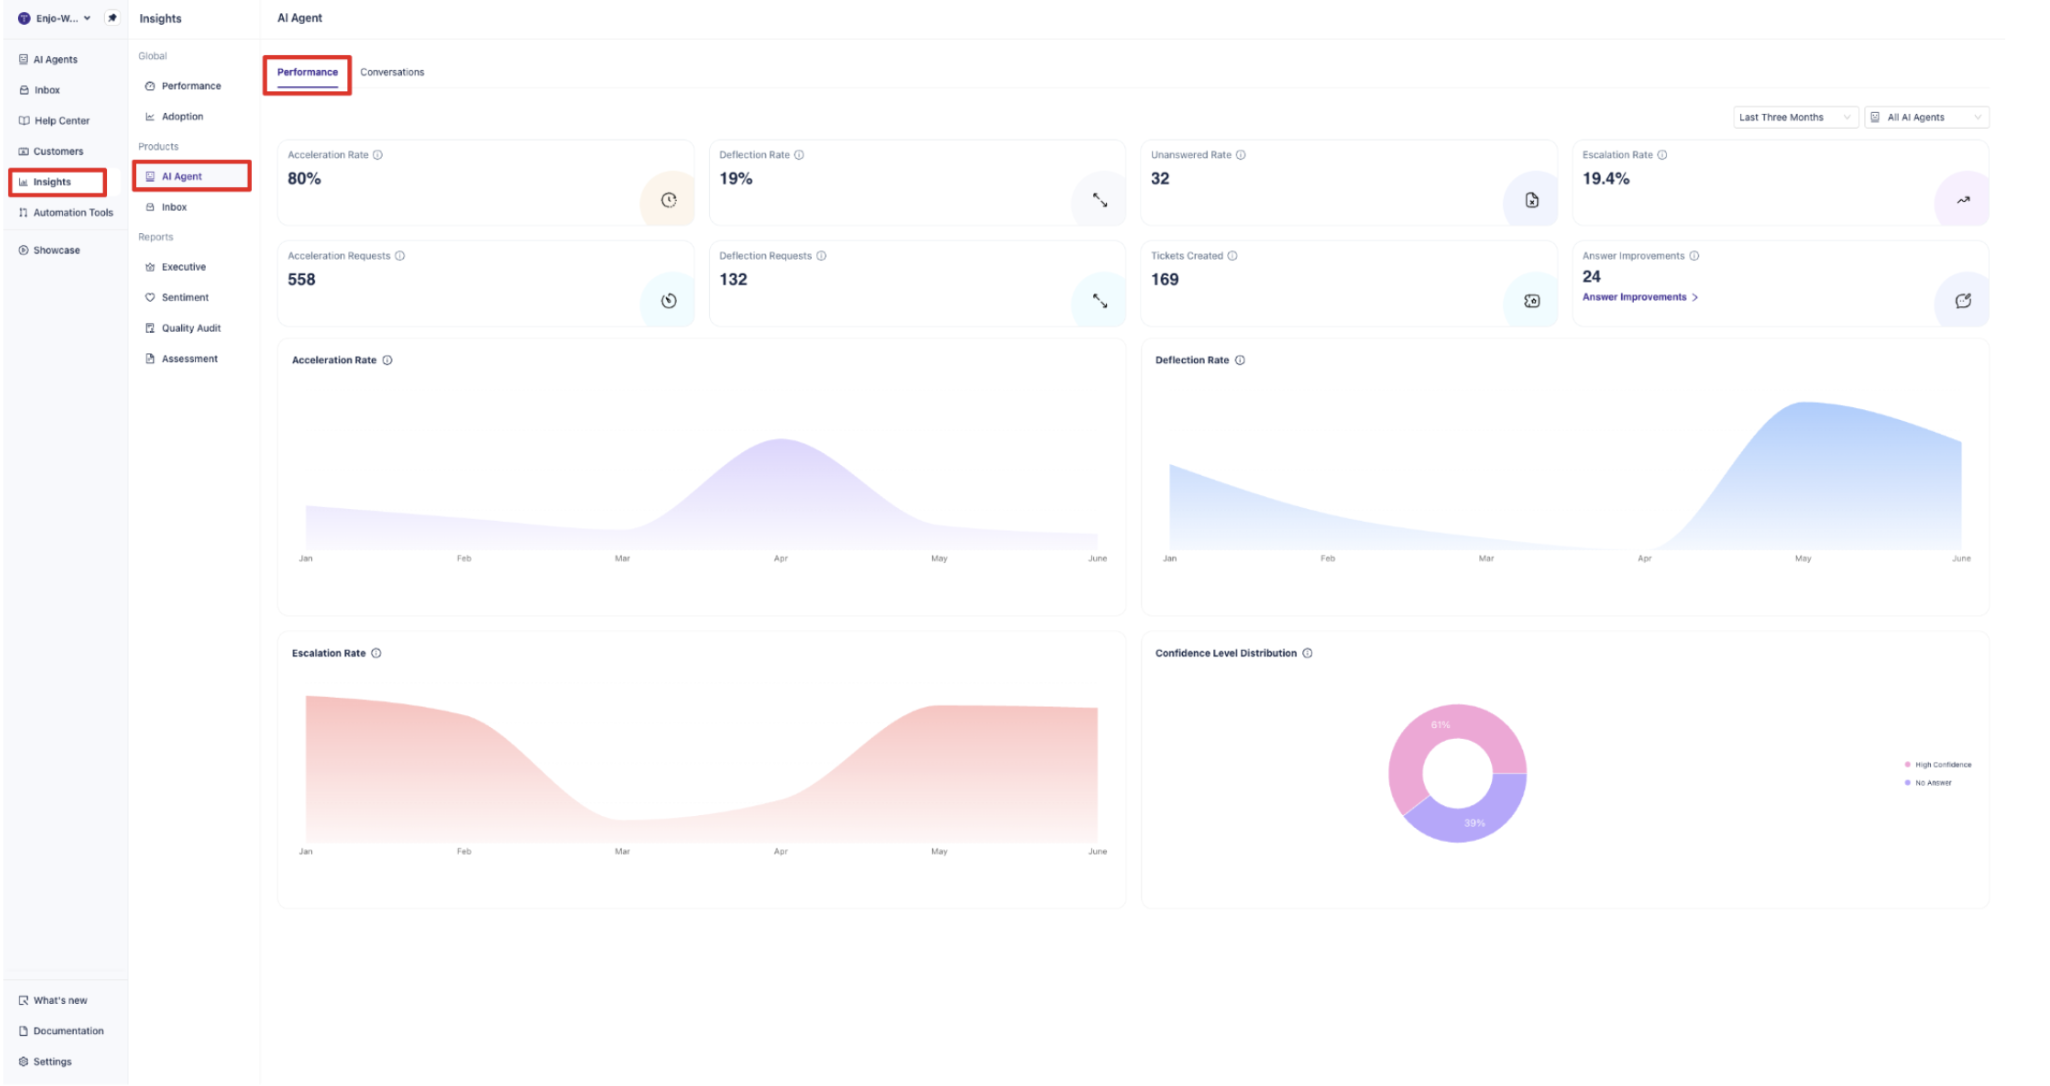
There are two tabs on this page:
Performance: Key metrics and trend charts for your AI Agent's effectiveness.
Conversations: A detailed log of individual conversations handled by the AI Agent.
This article covers the Performance tab.
Step 2: Set Your Filters
Before reading the metrics, set the time period and AI Agent scope you want to review.
Time Period
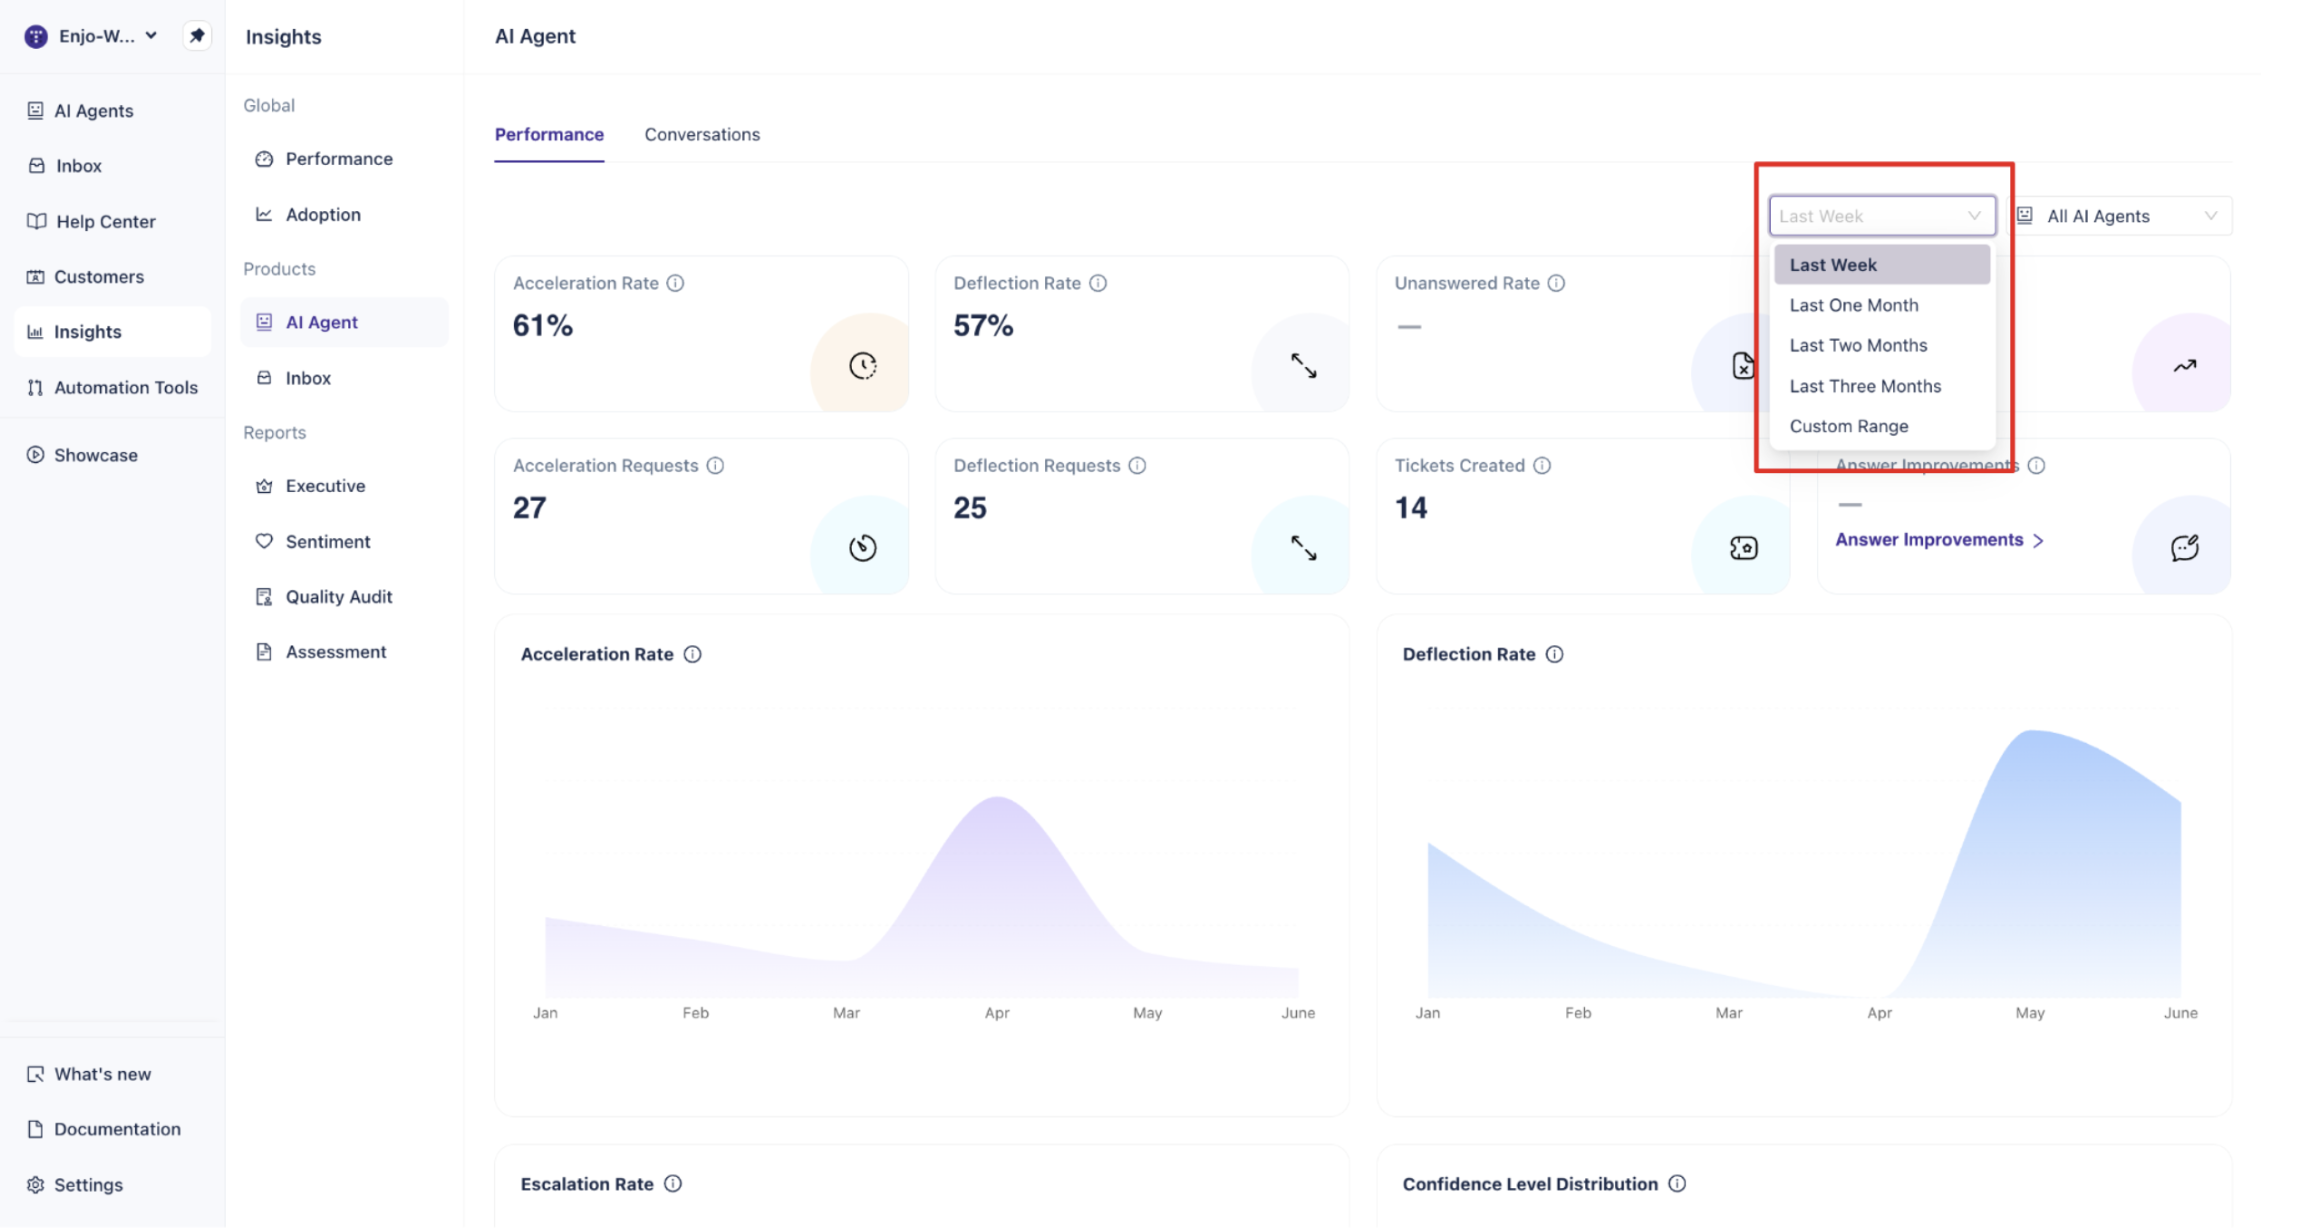
Use the date range dropdown in the top-right corner to select how far back the data should go.
Available options:
Last Week
Last One Month
Last Two Months
Last Three Months
Custom Range
All metrics and charts on the page update automatically when you change the time period.
AI Agent Filter
Next to the date range, use the AI Agents dropdown to filter data for a specific AI Agent. By default, data from all your AI Agents is combined. Select a specific agent from the list to isolate its performance.
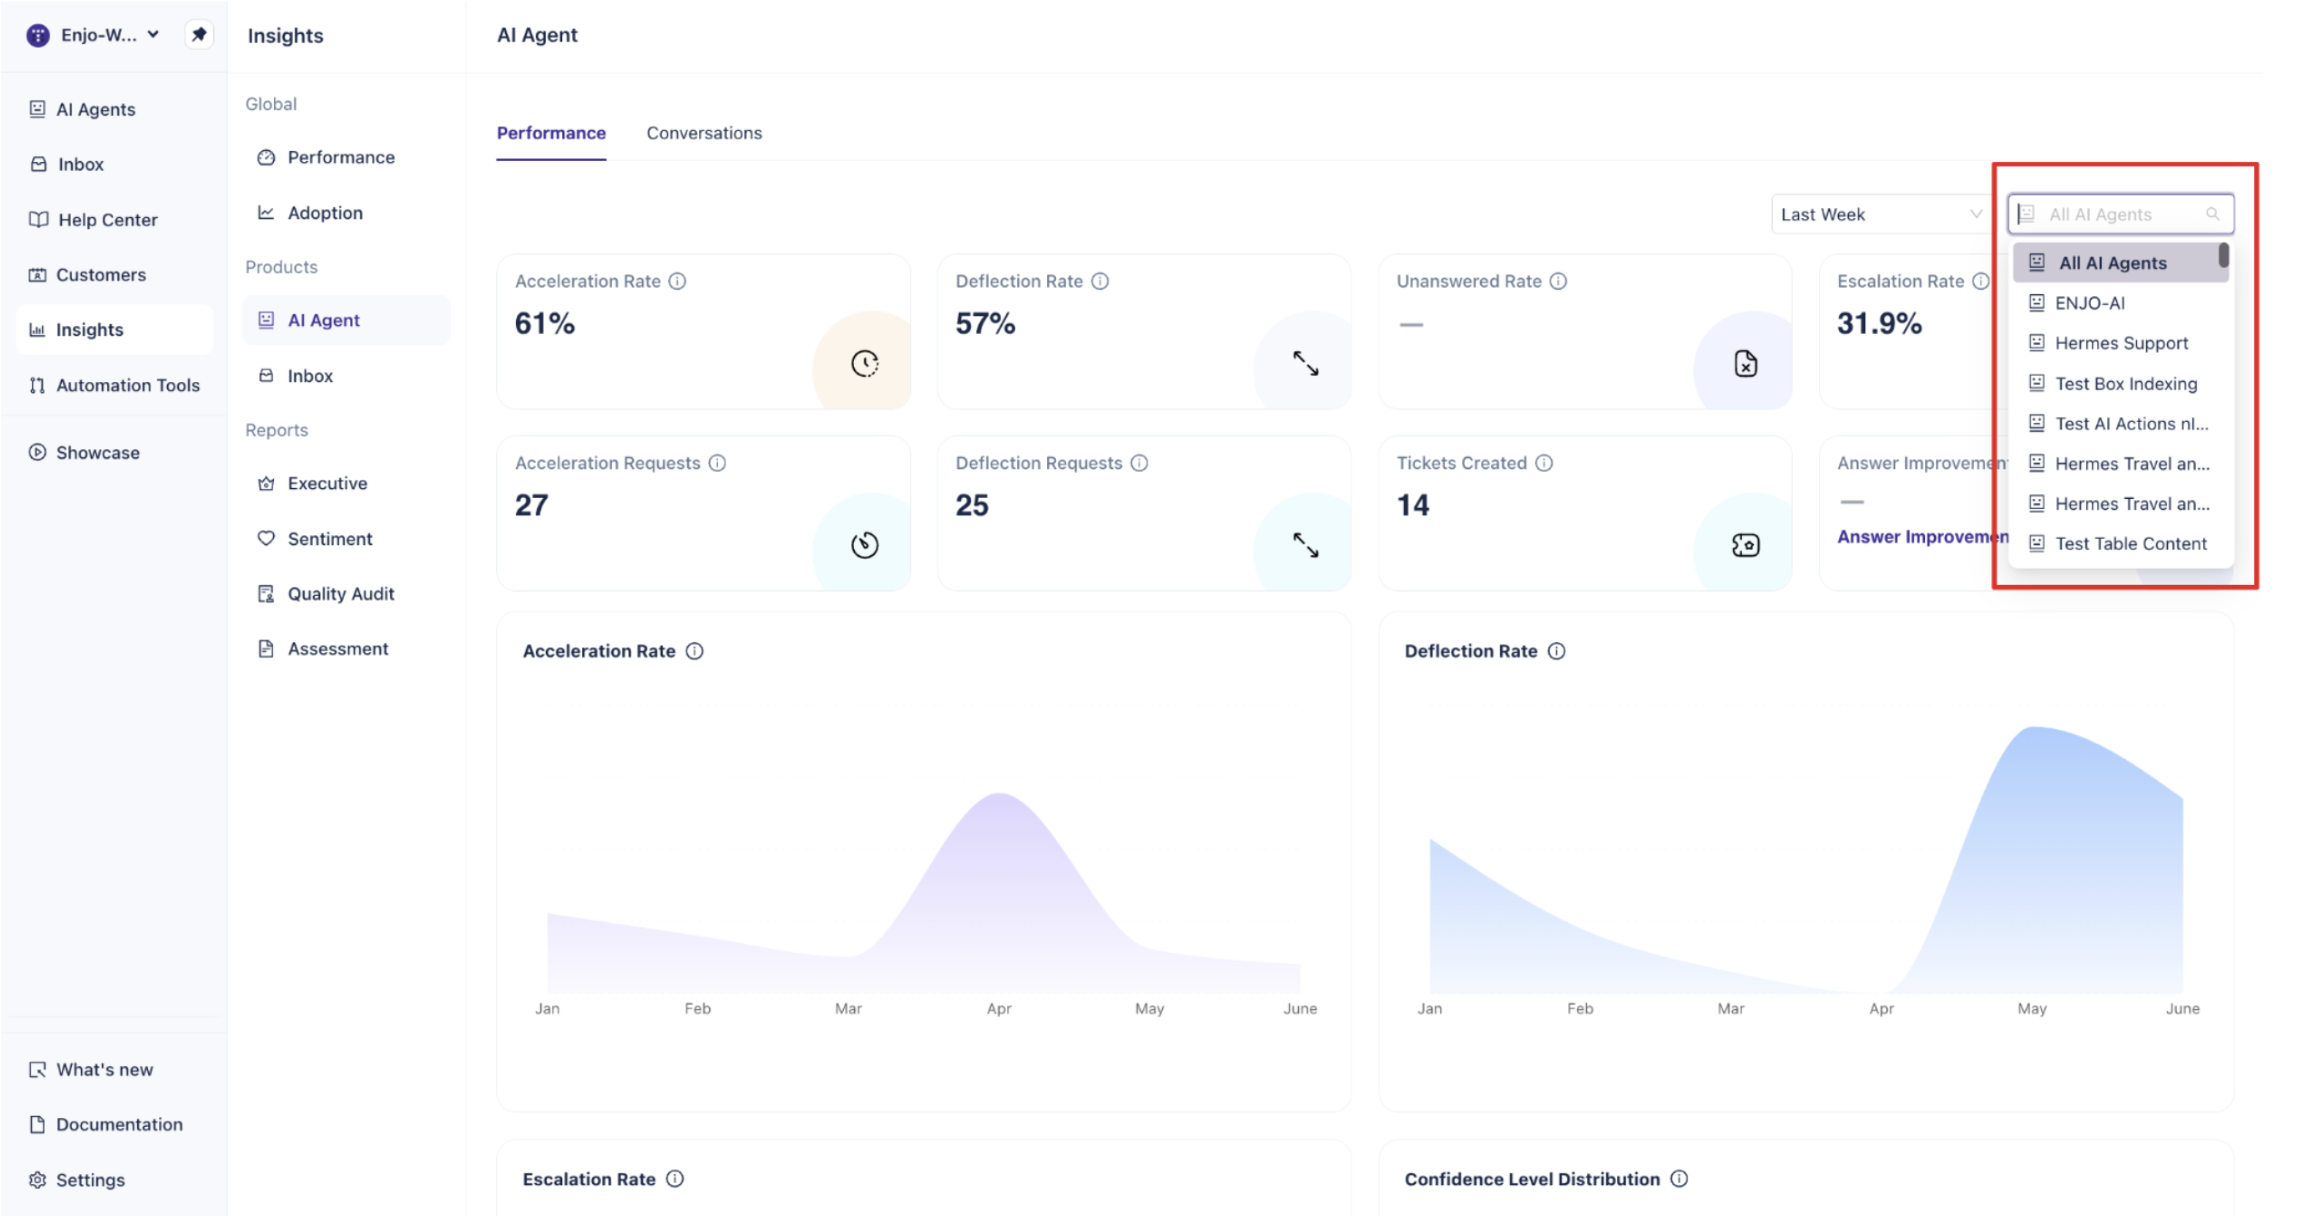
Tip: Use the agent filter when you have multiple AI Agents serving different teams or use cases. This lets you compare performance across agents individually.
Step 3: Read the Summary Metrics
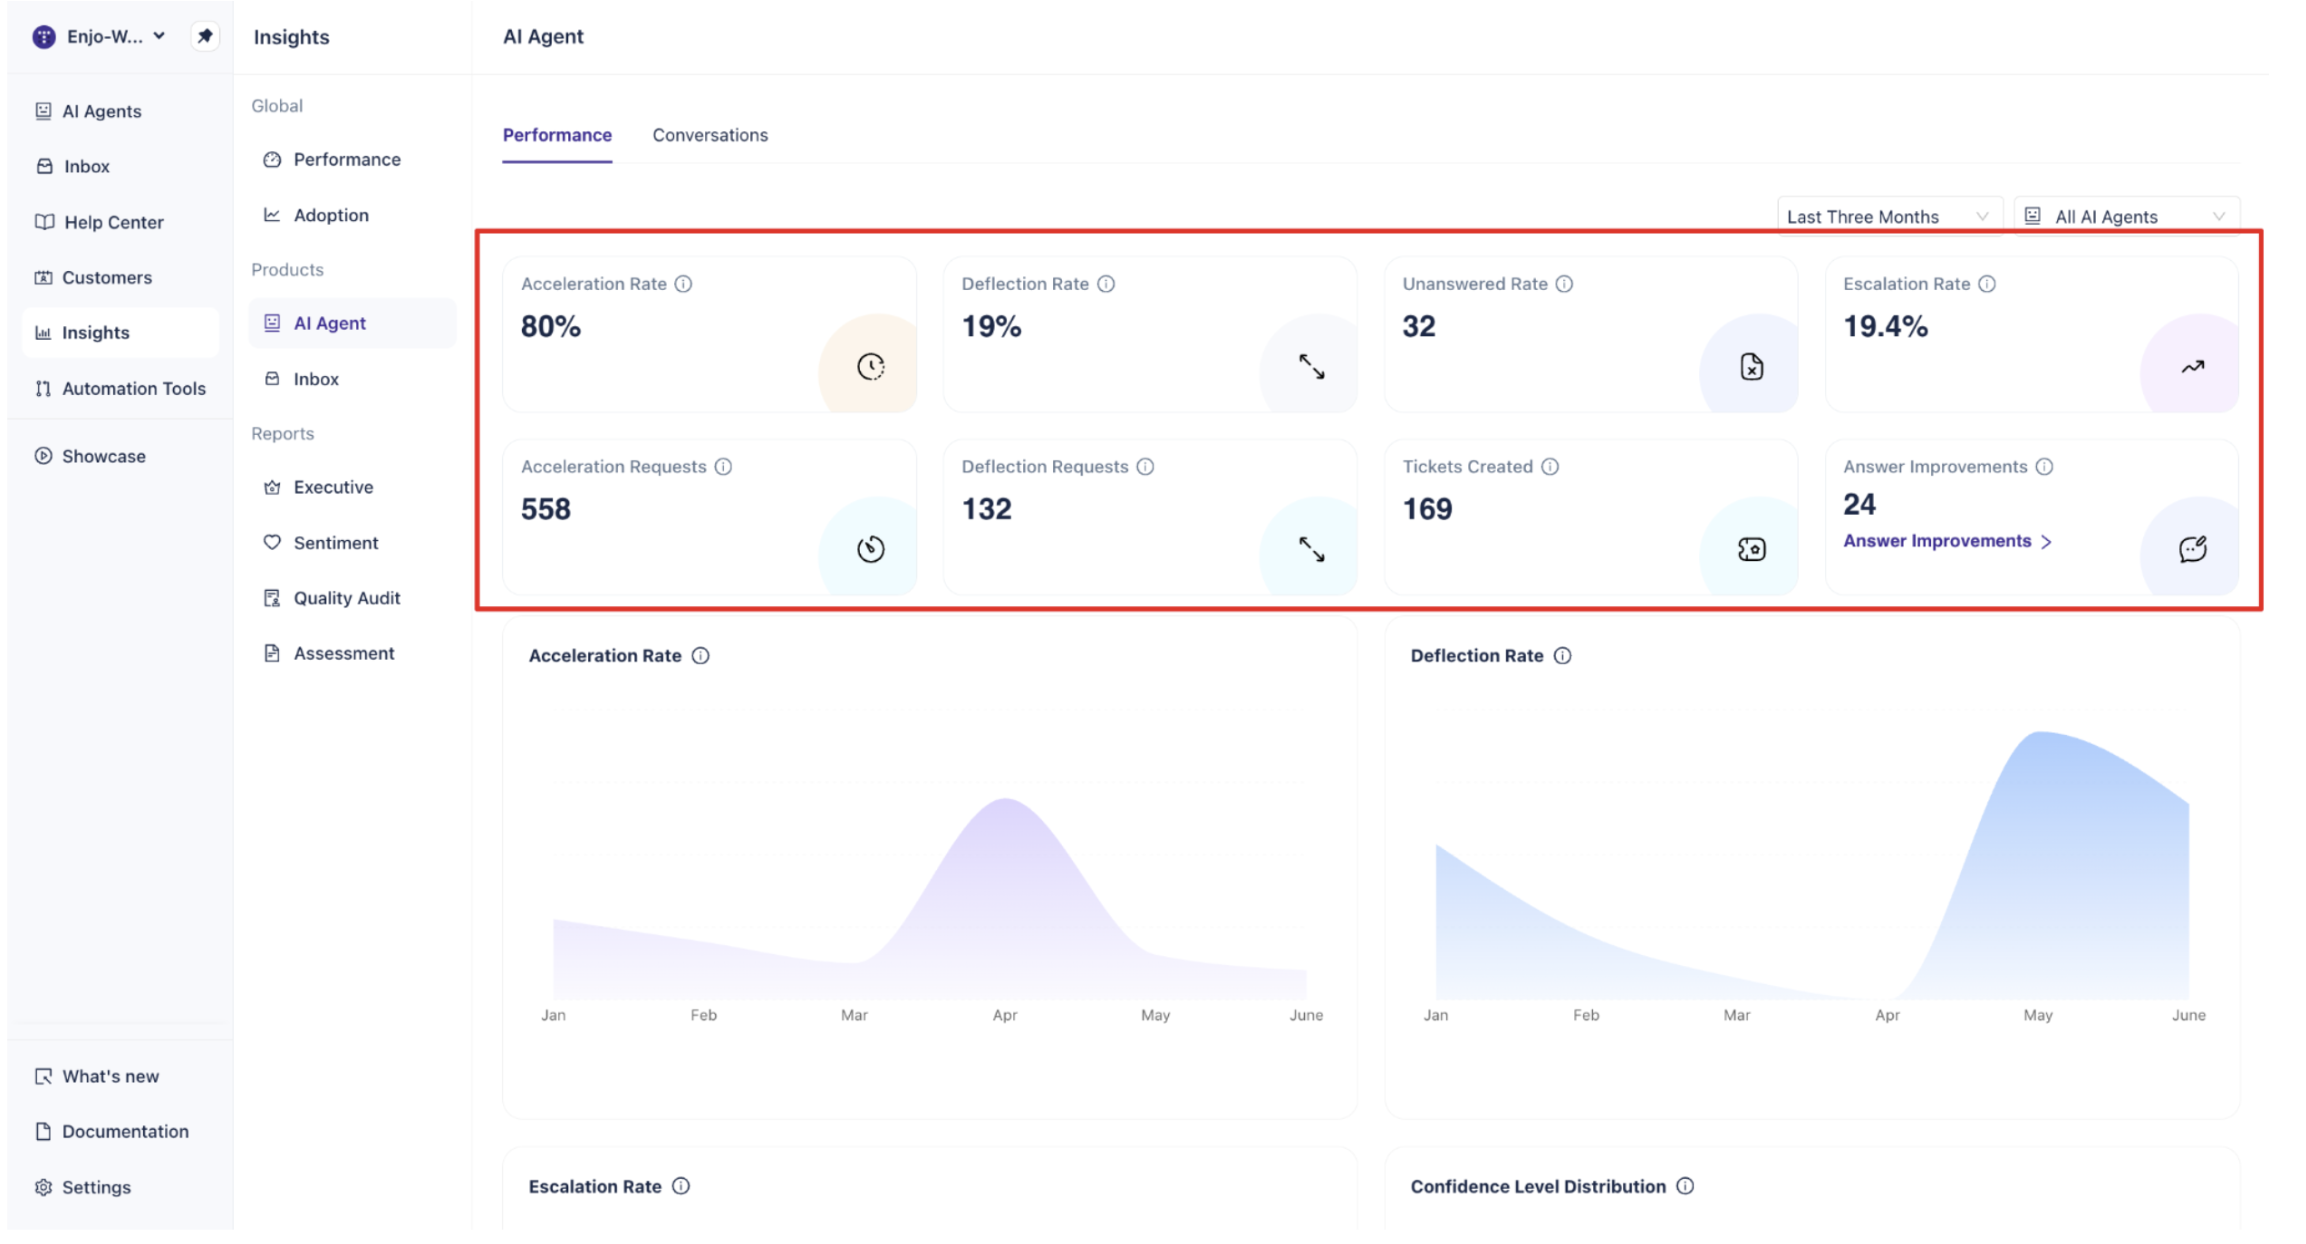
The top section of the Performance tab shows eight summary metrics. These give you an immediate snapshot of how the AI Agent is performing for the selected period.
Top Row
Acceleration Rate Percentage of conversations where the AI Agent had some helpful answer. This measures how often the agent was able to contribute meaningfully to a conversation, even if it did not fully resolve it.
Deflection Rate Percentage of conversations the AI Agent resolved automatically without needing a human agent. A higher deflection rate means the agent is handling more requests end-to-end.
Unanswered Rate Percentage of queries where the AI Agent had no helpful answer and did not resolve the conversation automatically. This is a useful indicator of knowledge gaps.
Escalation Rate Percentage of conversations that were escalated to a human agent. Monitoring this alongside the Deflection Rate gives you a clear picture of how much work is still landing with your support team.
Bottom Row
Acceleration Requests The number of conversations where the AI Agent had some helpful answer.
Deflection Requests The number of conversations the AI Agent resolved automatically.
Tickets Created The number of tickets created by the AI Agent in all platforms during the selected period.
Answer Improvements The number of answers that users flagged for improvement. Click the Answer Improvements link beneath the count to open a detailed breakdown. See Step 5 for more on this.
Step 4: Review the Performance Charts
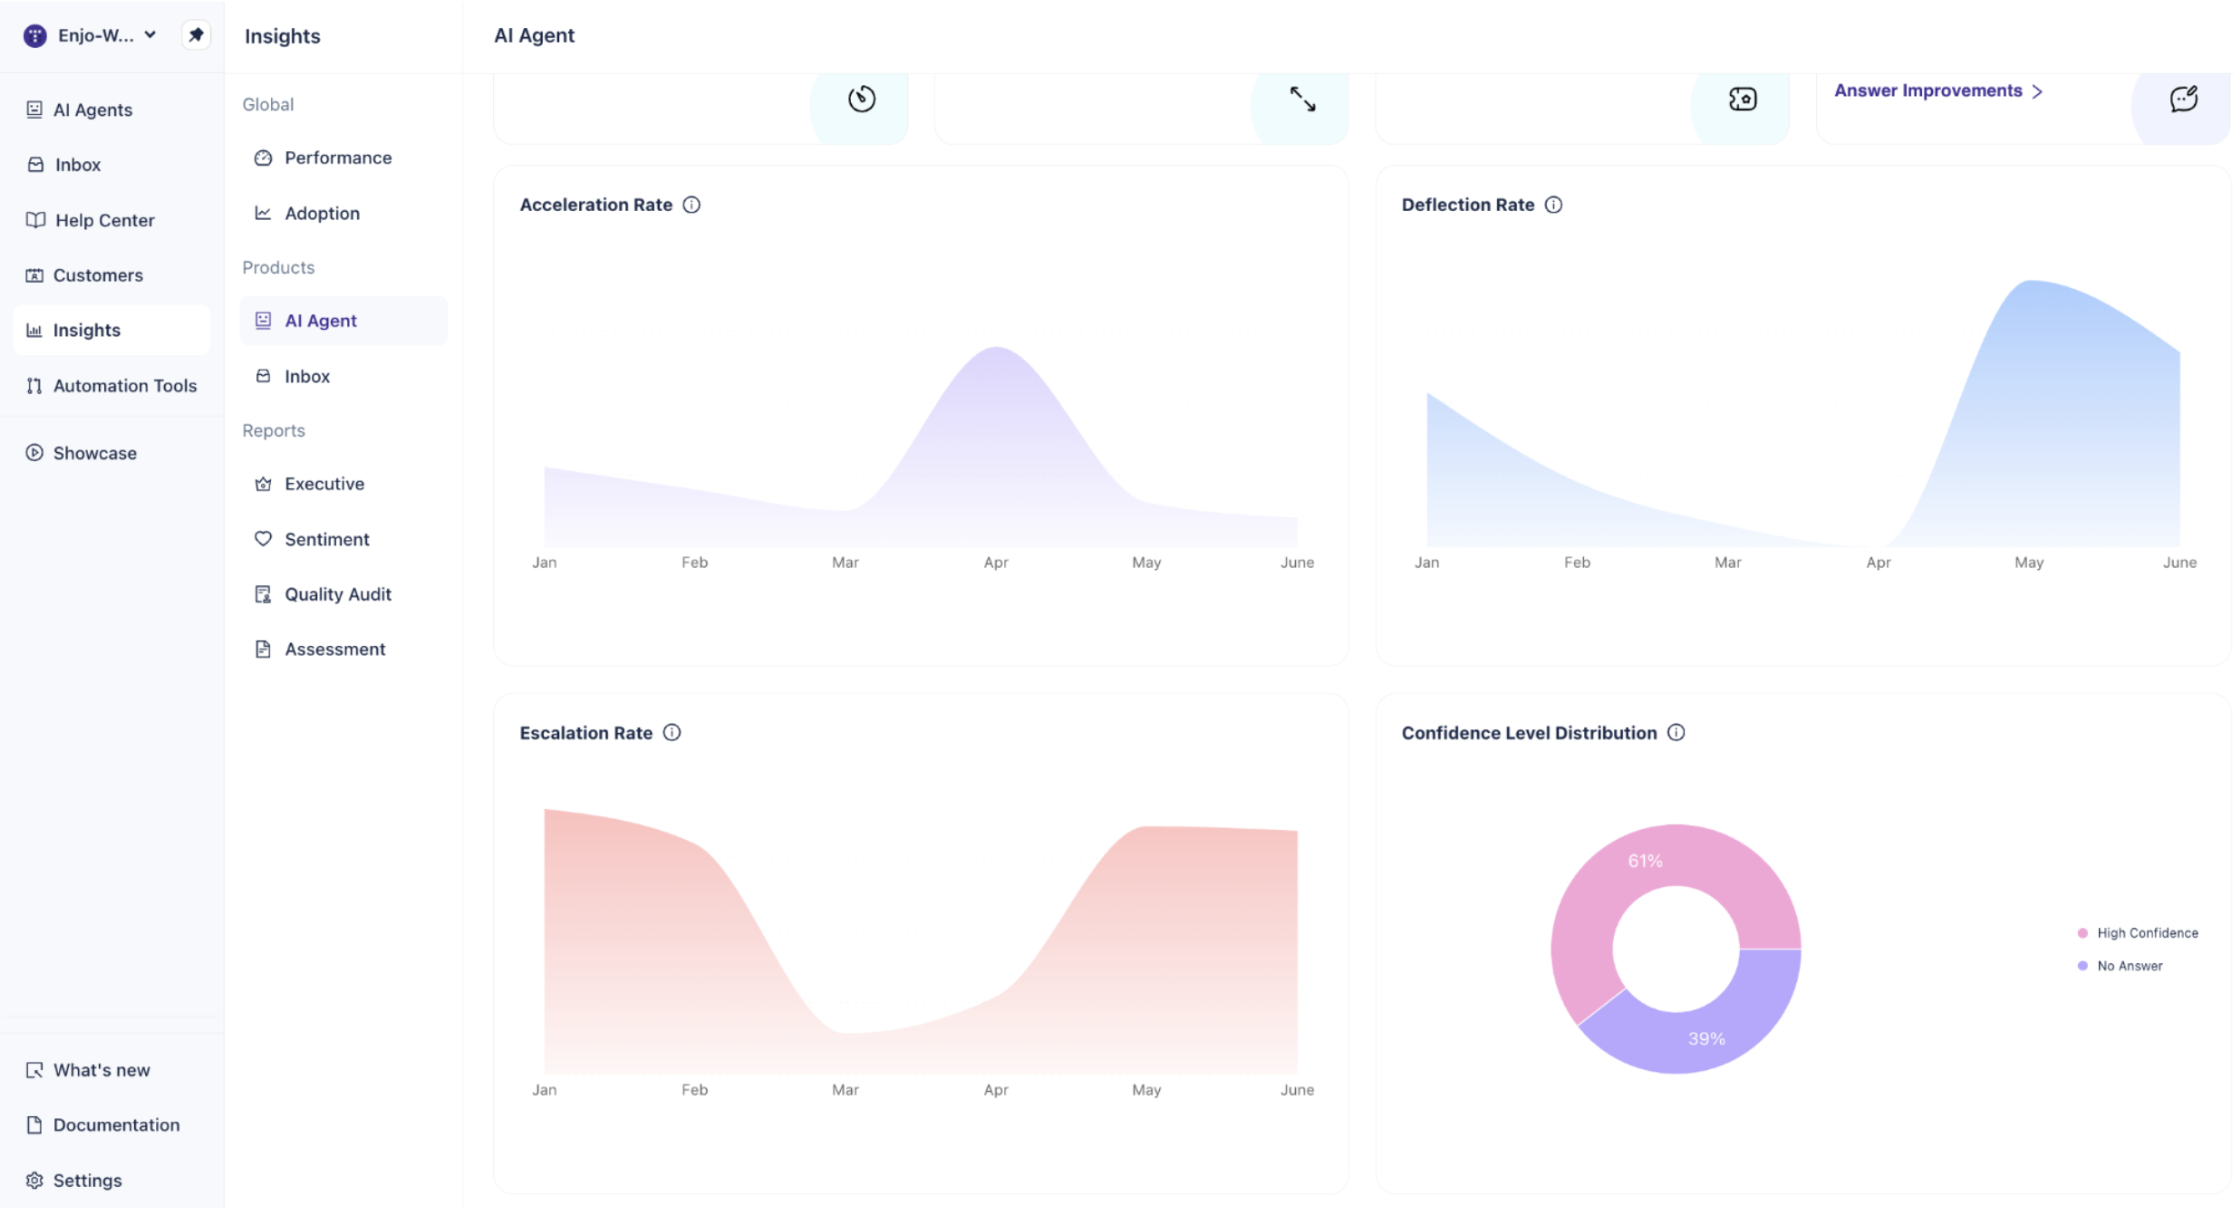
Below the summary metrics, four charts show how performance has changed over the selected time period.
Acceleration Rate
This area chart plots the Acceleration Rate trend over time. Use it to identify periods where the AI Agent was more or less able to contribute helpful answers. A consistent upward trend usually indicates knowledge base improvements are taking effect.
Deflection Rate
This chart shows how the Deflection Rate has changed over time. A rising Deflection Rate means the AI Agent is resolving a higher share of conversations on its own. A sudden drop may indicate new question types that the agent is not yet trained to handle.
Escalation Rate
This chart tracks the percentage of conversations escalated to human agents over the selected period. It is displayed in a pink/red area chart to distinguish it from the resolution metrics. Spikes in escalation may point to specific topics or timeframes where the AI Agent struggled.
Confidence Level Distribution
This donut chart shows the share of conversations broken down by the AI Agent's confidence level. The two segments are:
High Confidence: The AI Agent was confident enough to provide an answer.
No Answer: The AI Agent did not have a confident enough answer to respond.
The percentage split gives you a quick read on how often the agent is working within its knowledge versus hitting its limits.
Note: A high "No Answer" percentage is a signal to review your knowledge base. Adding or updating articles on the topics that are failing will directly improve both the Confidence Level Distribution and the Deflection Rate.
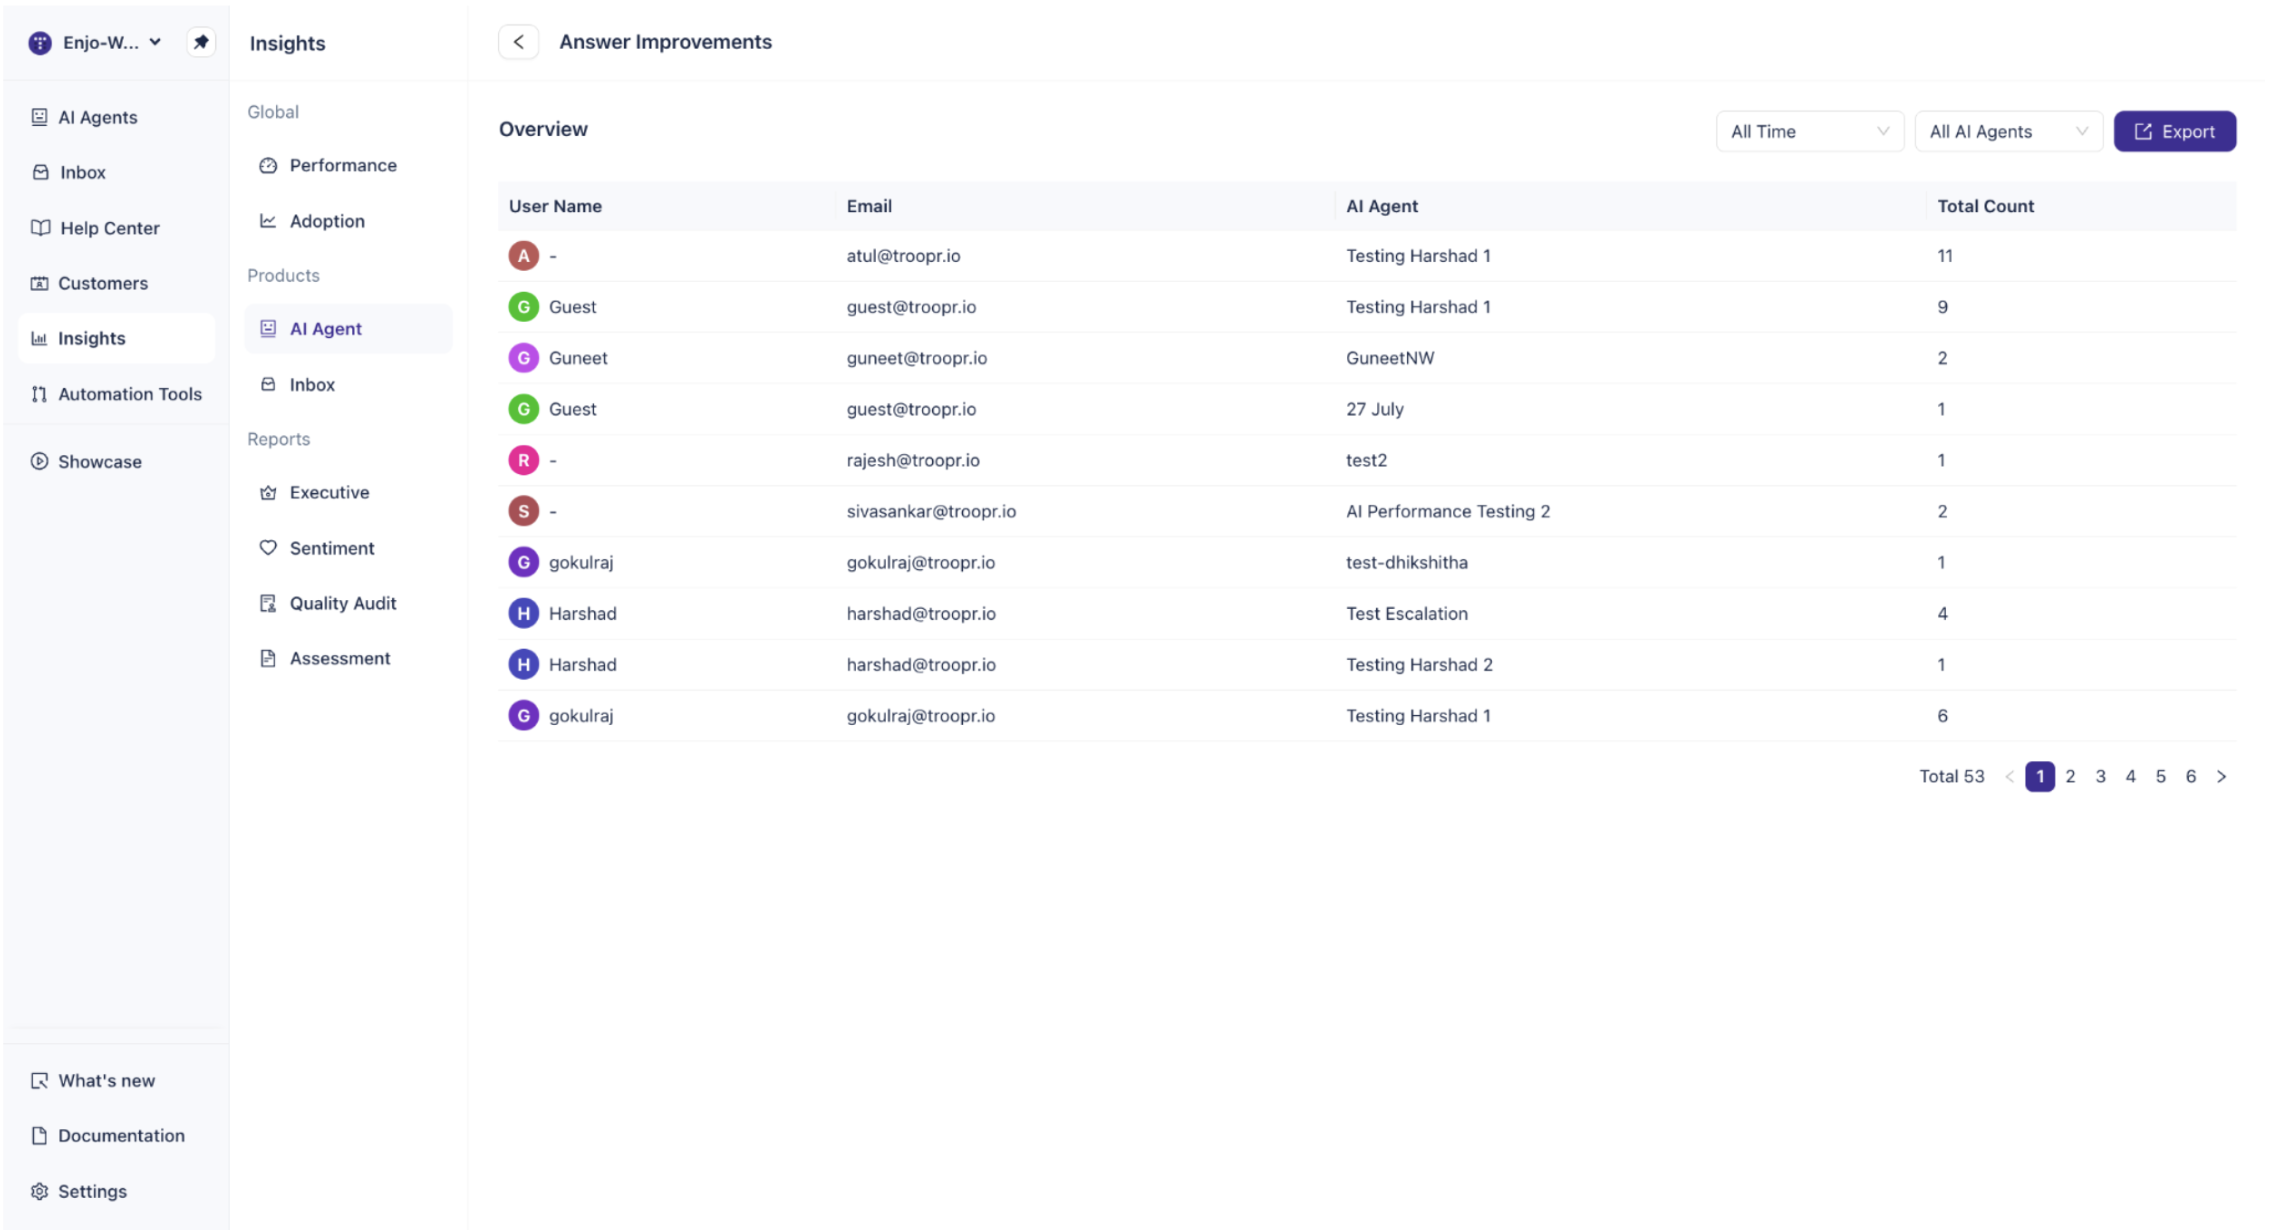
Step 5: Review Answer Improvements
When users improve an AI Agent response, it is recorded as an Answer Improvement. The count appears in the summary metrics row, and clicking Answer Improvements opens a detailed log.
The Answer Improvements table shows:
Column | Description |
User Name | The person who improved the answer |
Their email address | |
AI Agent | Which AI Agent produced the answer |
Total Count | Number of improvements by that user for that AI Agent |
The table is paginated and can be filtered by time period and by a specific AI Agent. Use the Export button to download the full list.
Tip: Reviewing Answer Improvements regularly is one of the most direct ways to improve AI Agent quality. Each improved answer points to a response that users found unhelpful, giving you clear direction on where to update your knowledge base or tune your agent's configuration.
What's Next
Now that you understand the AI Agent Performance report, here are a few related articles to explore:
AI Agent Conversations: Review individual conversations handled by the AI Agent, including full message logs.
Engagement: See how many users are interacting with Enjo and which modules are most active.
Sentiment: Understand how users feel about their AI Agent interactions.