
Sentiment
In this article, you'll learn how to create and manage sentiment reports to track customer sentiment trends, identify satisfaction issues, and export data for analysis.
Before you start
You must be an Owner, Admin, or Insights manager in your Enjo workspace
Your helpdesk platform (Salesforce, Zendesk, etc.) must already be connected to Enjo
You have access to cases/tickets in your connected helpdesk platform
Allow 15–20 minutes to create a sentiment report and configure initial filters
For Salesforce users: basic SOQL (Salesforce Object Query Language) familiarity is helpful but not required
How it works
Sentiment Reports analyze customer sentiment across support conversations in your helpdesk platform. Enjo examines conversation text and detects sentiment signals—words, tone, and context that indicate customer satisfaction or frustration.
You can create two types of sentiment reports:
Live Reports — Real-time, continuously updated sentiment tracking. As new conversations occur, sentiment data is automatically added to the report. Use live reports to monitor current customer satisfaction trends and catch emerging issues immediately.
Historical Reports — Point-in-time analysis of a past period. You specify a date range (e.g., last 90 days), and Enjo generates a comprehensive snapshot of sentiment across that period. Use historical reports to identify patterns, trends, and problem areas over time.
How Enjo detects sentiment: Enjo's AI analyzes conversation text to classify sentiment into four categories:
Positive — Customer expresses satisfaction, appreciation, or resolution
Negative — Customer expresses frustration, anger, or dissatisfaction
Neutral — Conversation is factual or transactional with no clear sentiment signal
Need Attention — Conversation contains signals suggesting the case requires immediate action (e.g., repeated complaints, urgent language, escalation requests)
ℹ️ Note: Sentiment is detected at the conversation level, not individual messages. A single conversation is classified based on overall sentiment signals across all messages.
Common use cases:
Monitor which products/services receive the most negative sentiment
Identify support agents needing additional training (negative sentiment spike)
Spot when a customer becomes frustrated during a ticket lifecycle
Compare sentiment trends week-over-week to measure satisfaction improvements
Find accounts at risk (high negative sentiment) before they churn
Validate that support changes (e.g., new knowledge articles) improve sentiment
Create a Live Sentiment Report
Live reports continuously update as new conversations arrive in your helpdesk. Use them for real-time monitoring and trend spotting.
Step 1: Access Sentiment Reports
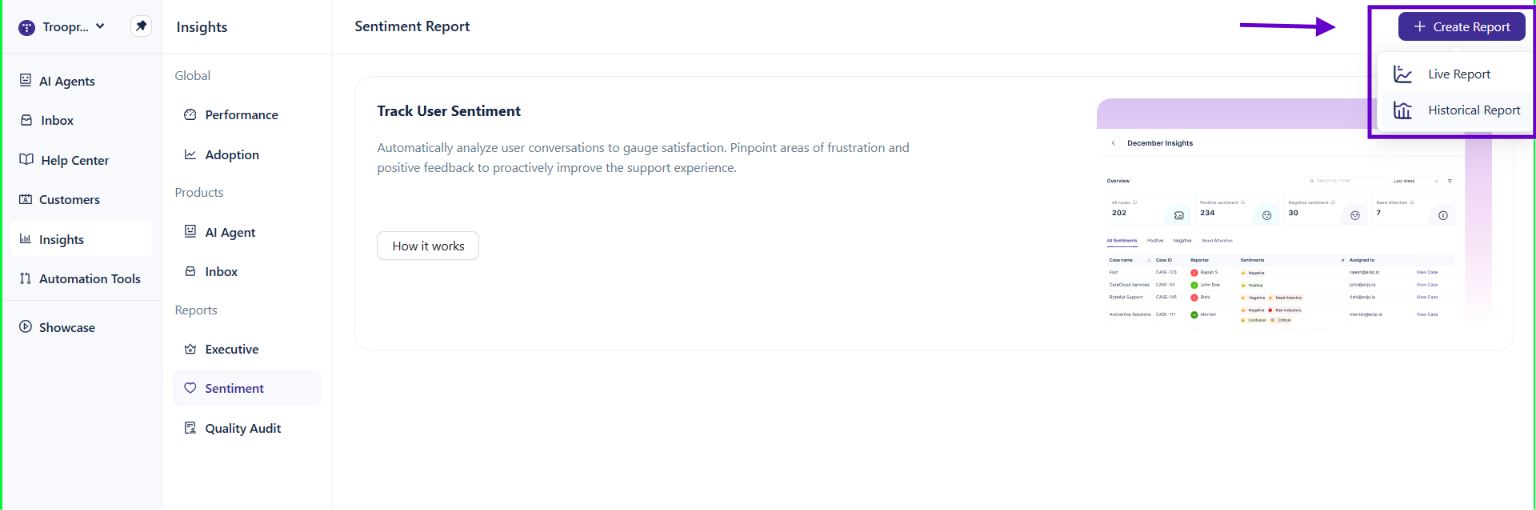
From the left navigation, click Insights > Sentiment.
The Sentiment Report page opens, displaying any existing reports.
Click + Create Report.
The Create Sentiment Report modal opens.
Step 2: Enter report name and description
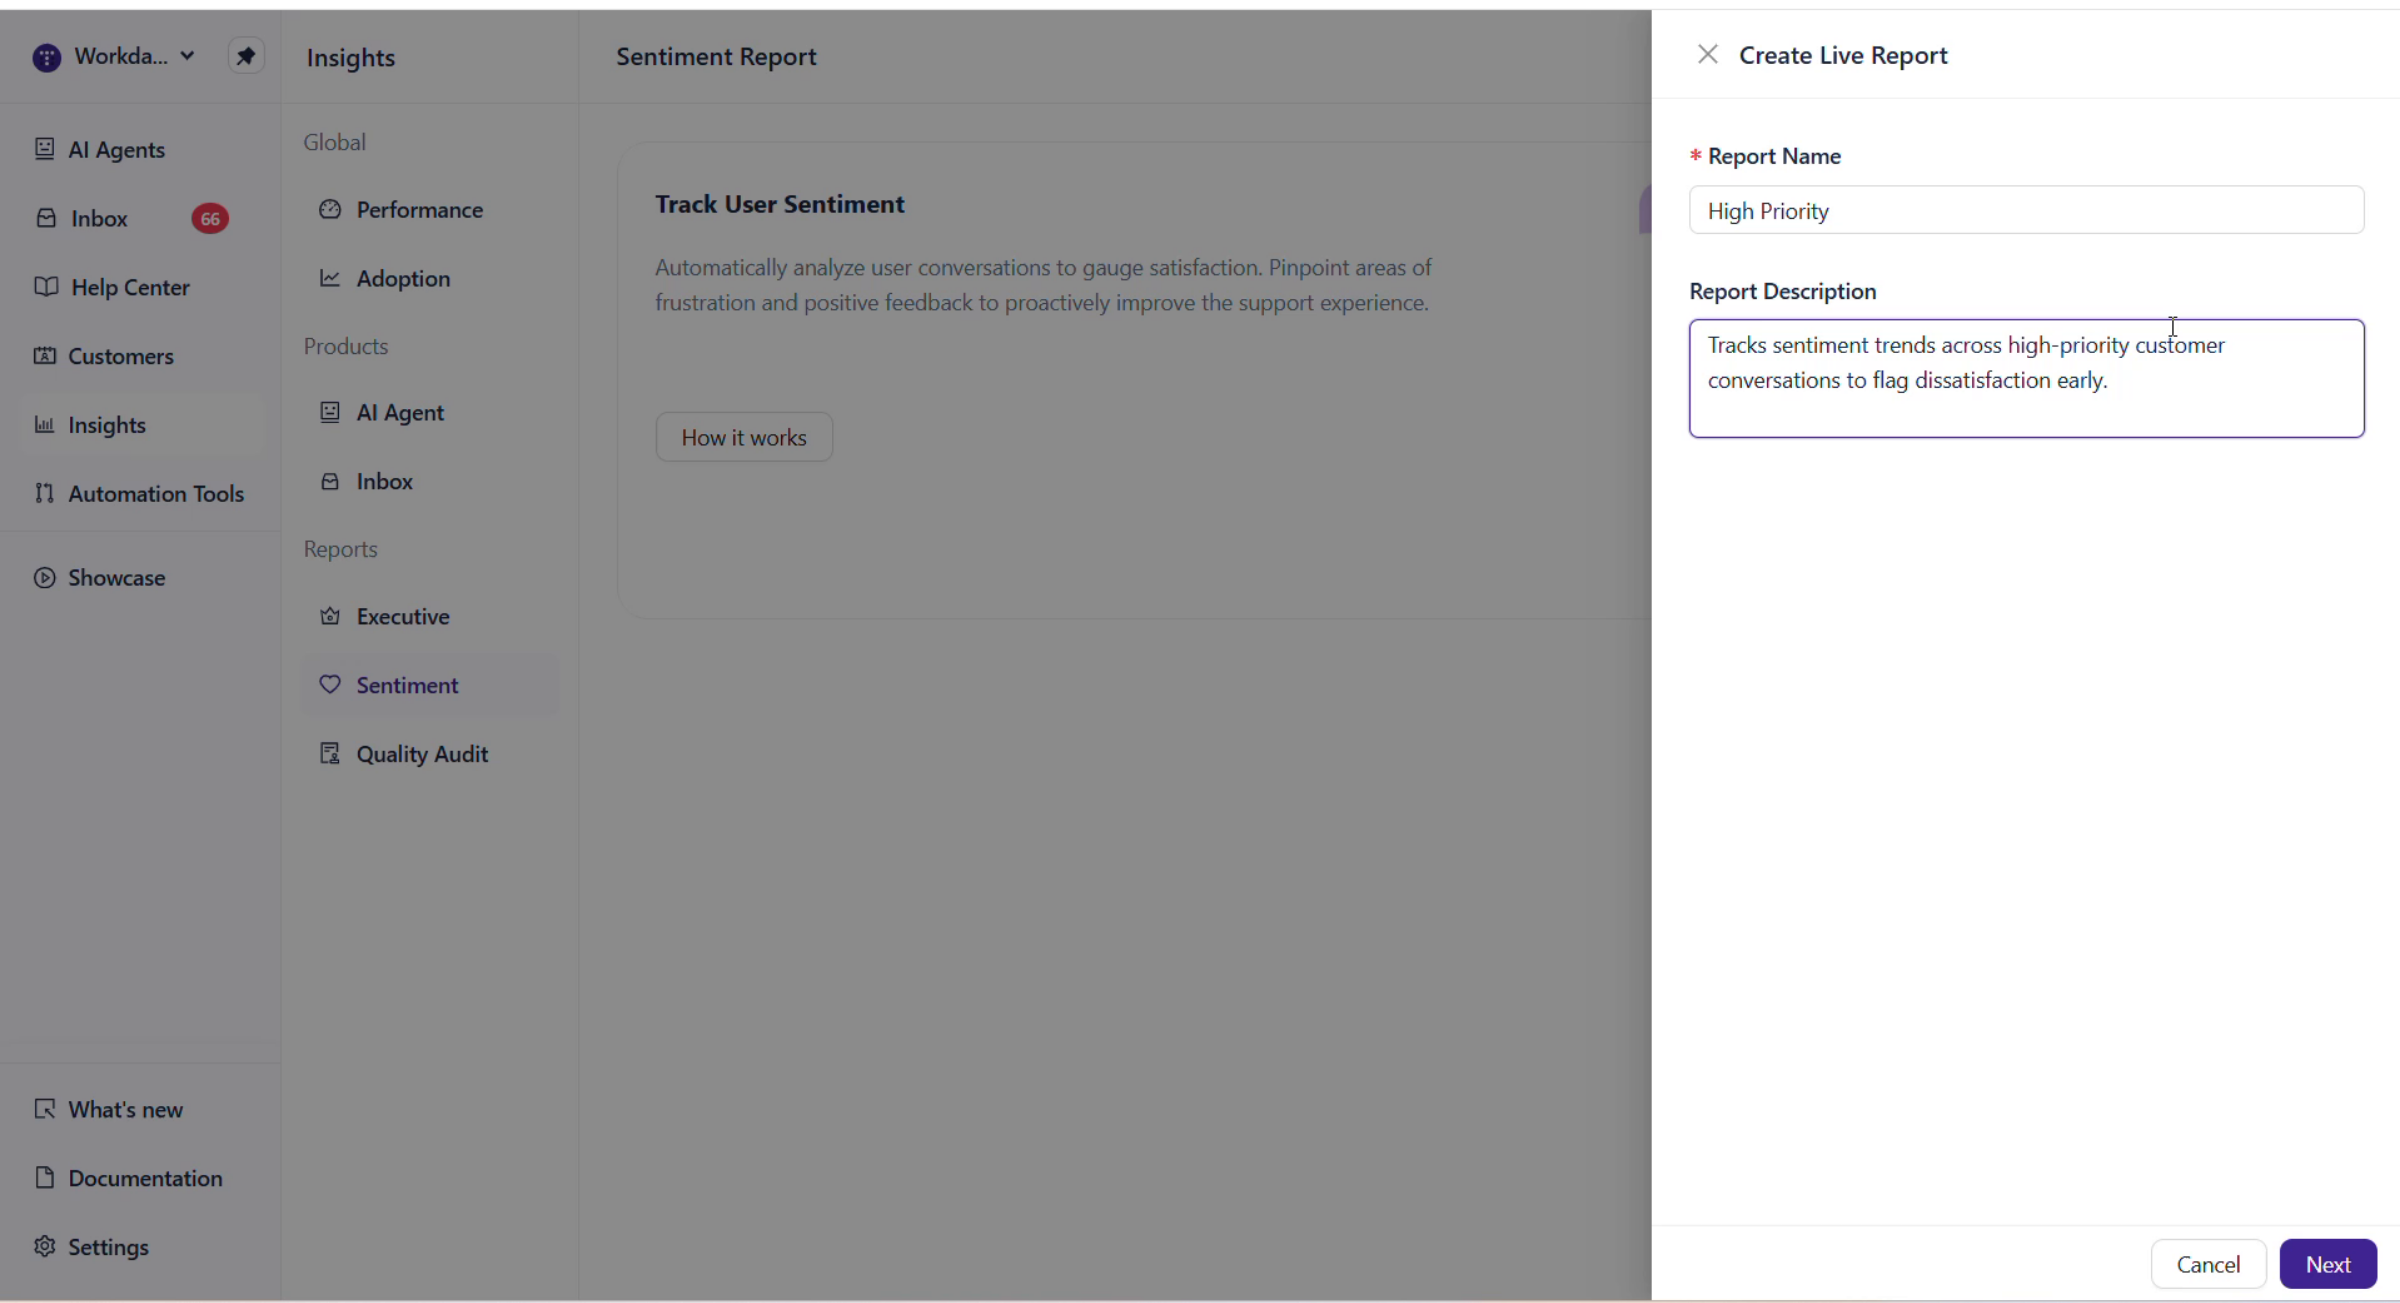
Enter a Report Name.
Choose a clear, descriptive name that reflects the report's focus.
Examples:
"High Priority Customers Sentiment"
"Product A Support Sentiment"
"Weekly Team A Satisfaction"
Enter a Report Description (optional).
Describe the report's purpose and scope so team members understand when to use it.
Example: "Tracks sentiment trends across high-priority customer accounts to identify satisfaction issues early."
Click Next.
The helpdesk selection step opens.
Step 3: Select your helpdesk platform
Click Select Helpdesk App.
A list of available helpdesk platforms appears (e.g., Salesforce Cases, Zendesk, ServiceNow).
Select the platform where your support cases are managed.
All currently connected accounts/instances for that platform appear.
Select the specific account or instance if multiple are available.
Example: "HR Support" Salesforce org.
Click Next.
The query/filter configuration step opens.
ℹ️ Note: If your helpdesk platform doesn't appear, connect it first in Settings > Integrations or Settings > Apps.
Step 4: Define which cases to include (SOQL Query)
Enter a query that specifies which cases to include in the report.
For Salesforce users: Use SOQL (Salesforce Object Query Language) syntax. This query filters cases before sentiment analysis.
Examples:
Priority = 'High'— Include only high-priority casesStatus = 'Open'— Include only open casesCreatedDate >= LAST_N_DAYS:90— Include only cases from the last 90 daysPriority = 'High' AND Account.Name = 'Acme Corp'— Combine multiple conditions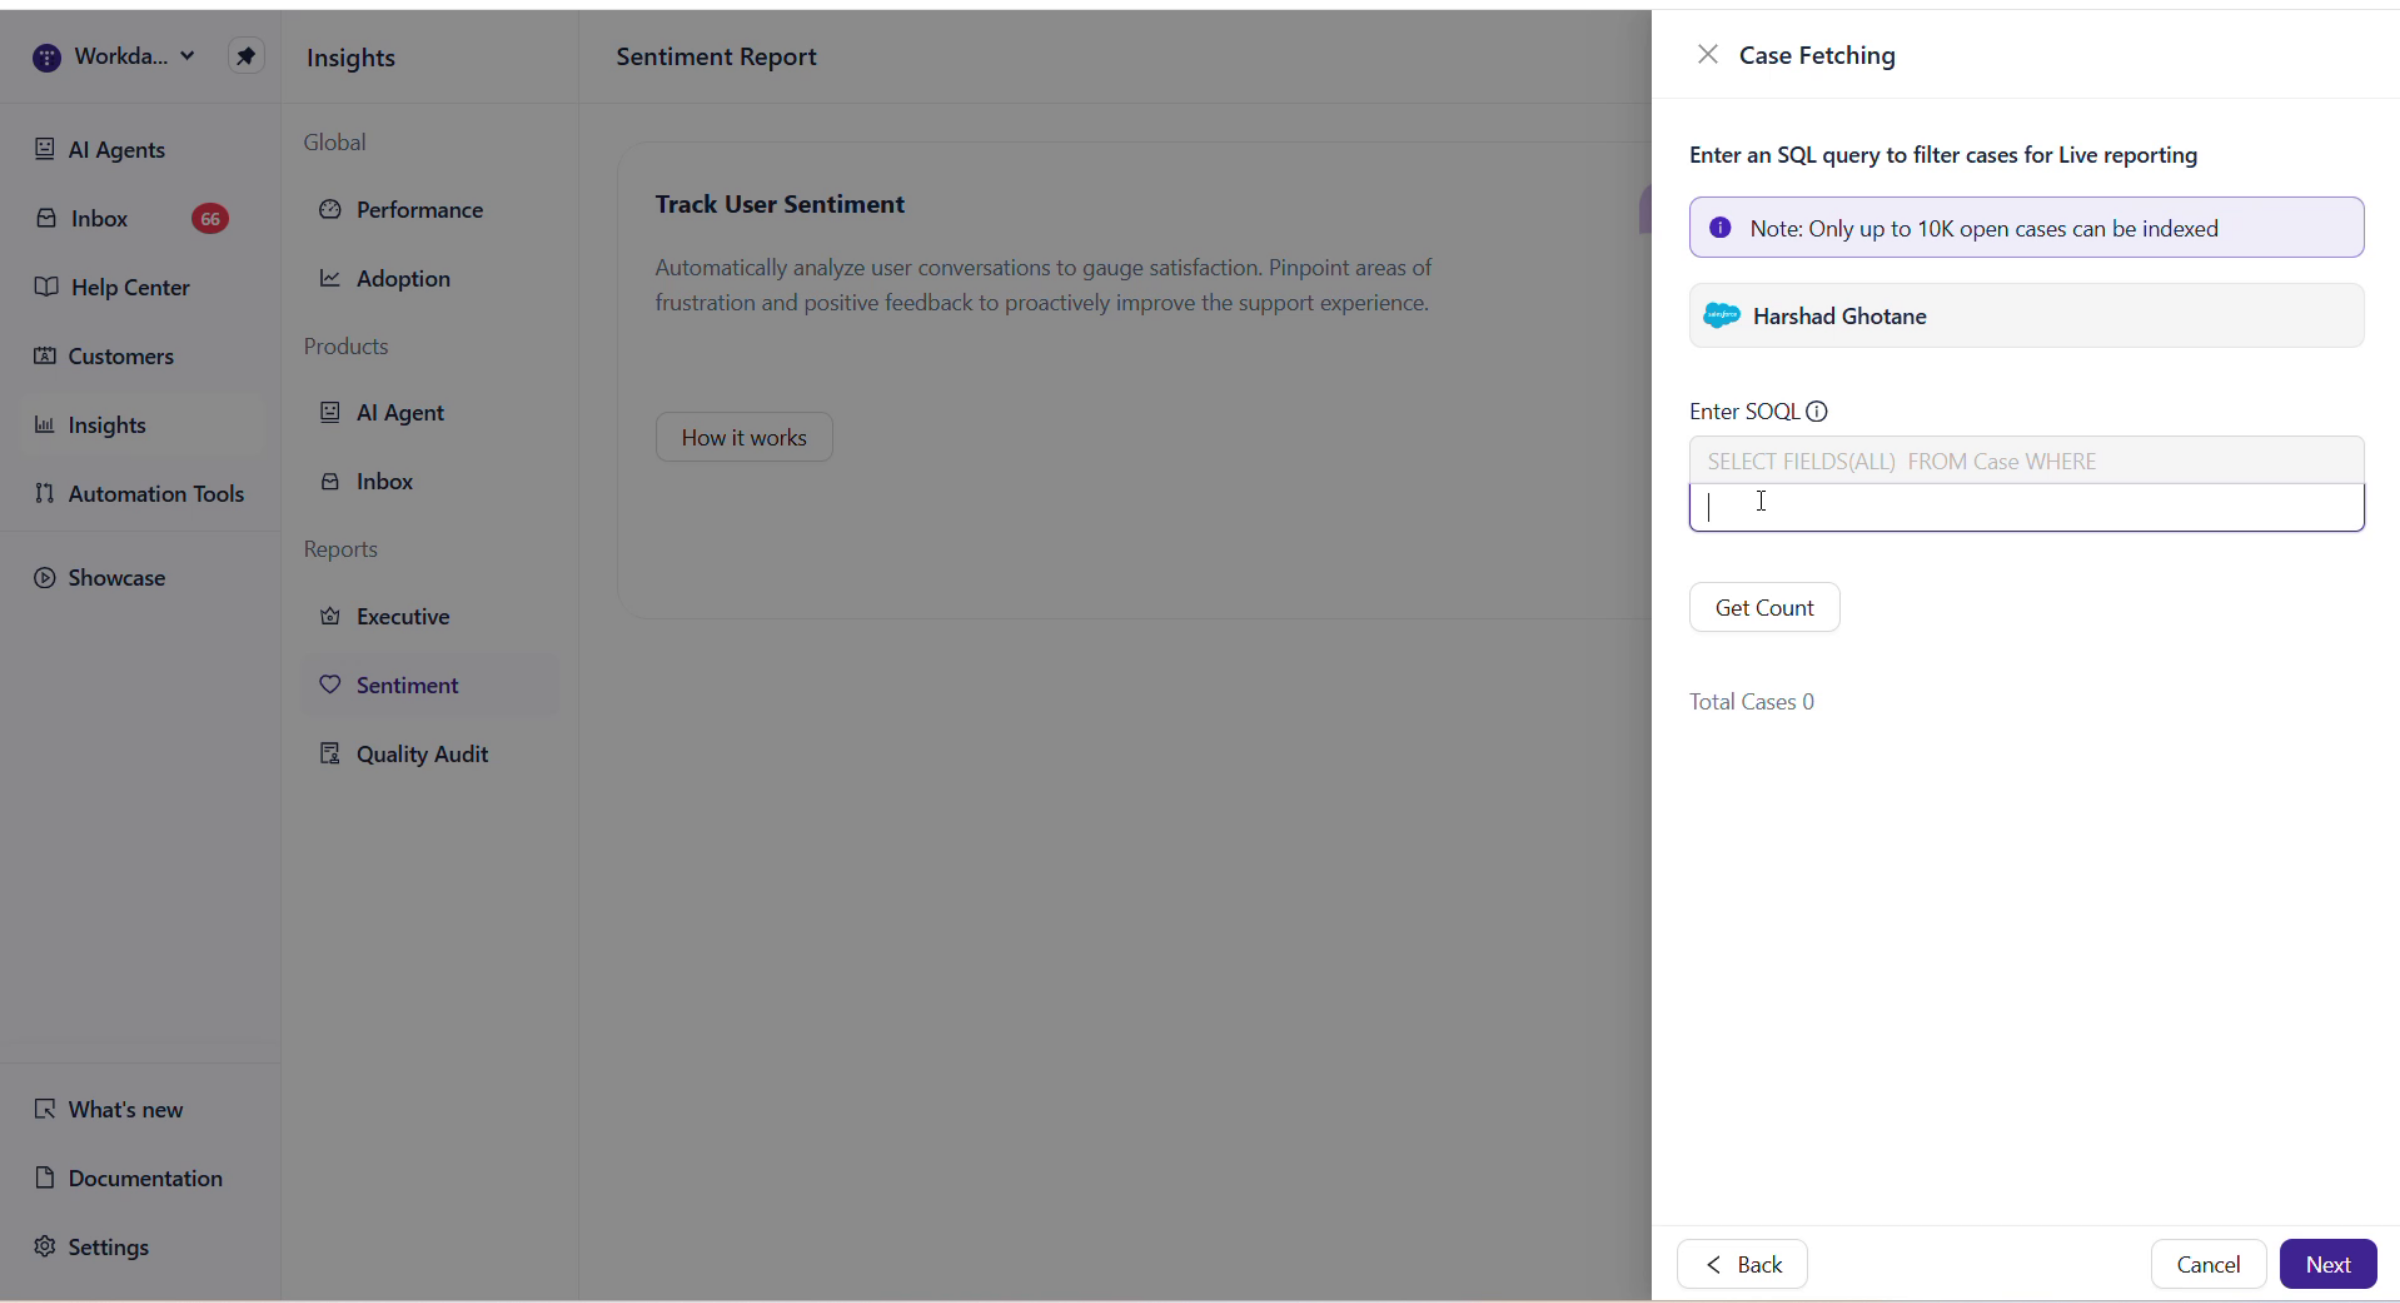
For other platforms: Enter filter criteria using your platform's native syntax or select from available filters.
Click Get Count.
Enjo processes your query and returns the number of matching cases. This validates that your query syntax is correct and shows you the scope of the report.
If the count is too high or too low, revise your query and click Get Count again.
Once you're satisfied with the case scope, click Next.
The field selection step opens.
ℹ️ Tip: Start with simpler queries and add complexity as needed. Your SOQL query determines which cases are analyzed; sentiment is then detected within those cases.
Step 5: Select fields for filtering
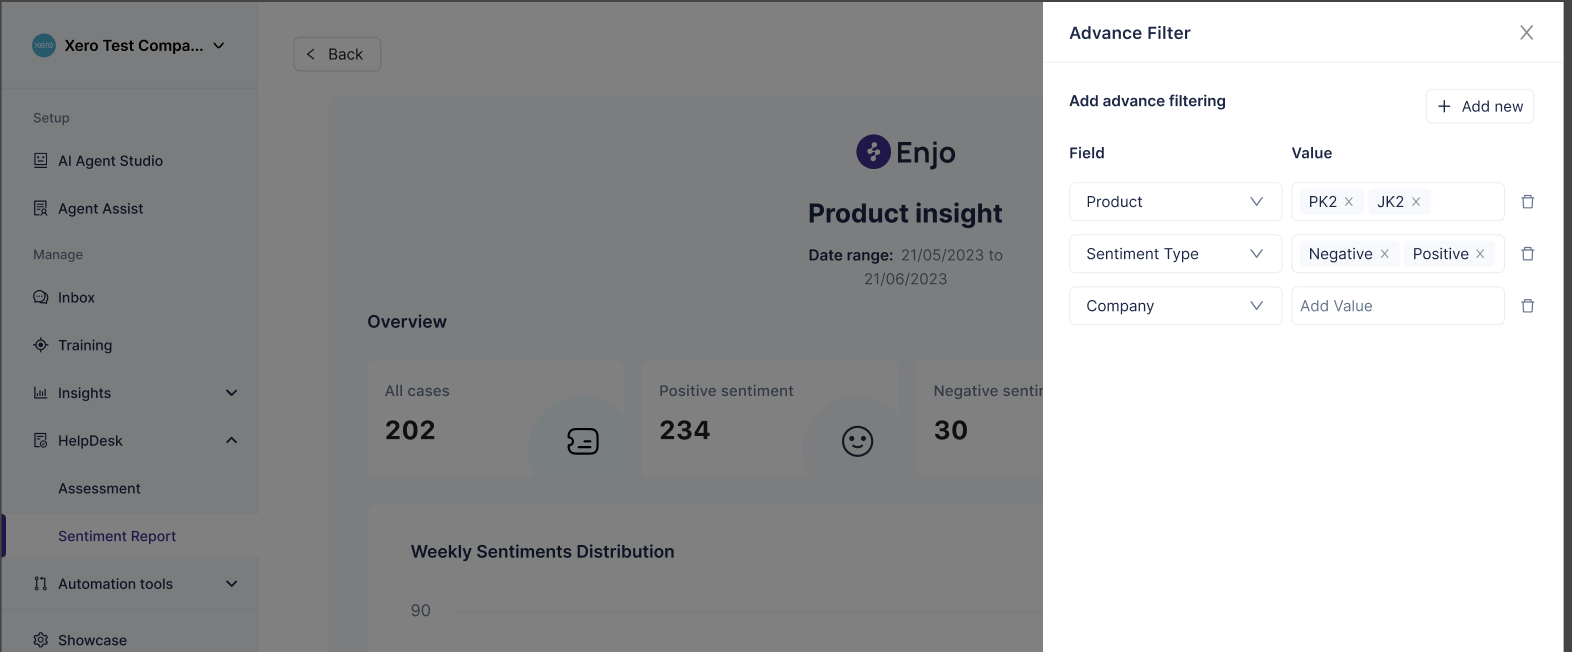
When viewing the report later, you'll be able to filter results by the fields you select here. Choose fields you'll want to slice and analyze the data by.
Click Select Case Field.
A list of available fields from your helpdesk platform appears (e.g., Status, Priority, Case Reason, Account Name, Owner).
Select only essential fields you'll use for analysis.
Example selections for a typical report:
Status (Open, Closed, etc.)
Priority (High, Medium, Low)
Case Reason (Installation, Billing, Technical, etc.)
Account Name
Owner/Agent
Avoid selecting too many fields. More fields = slower filtering in the report dashboard.
Click Build Report (or similar confirmation button).
The report is queued for building.
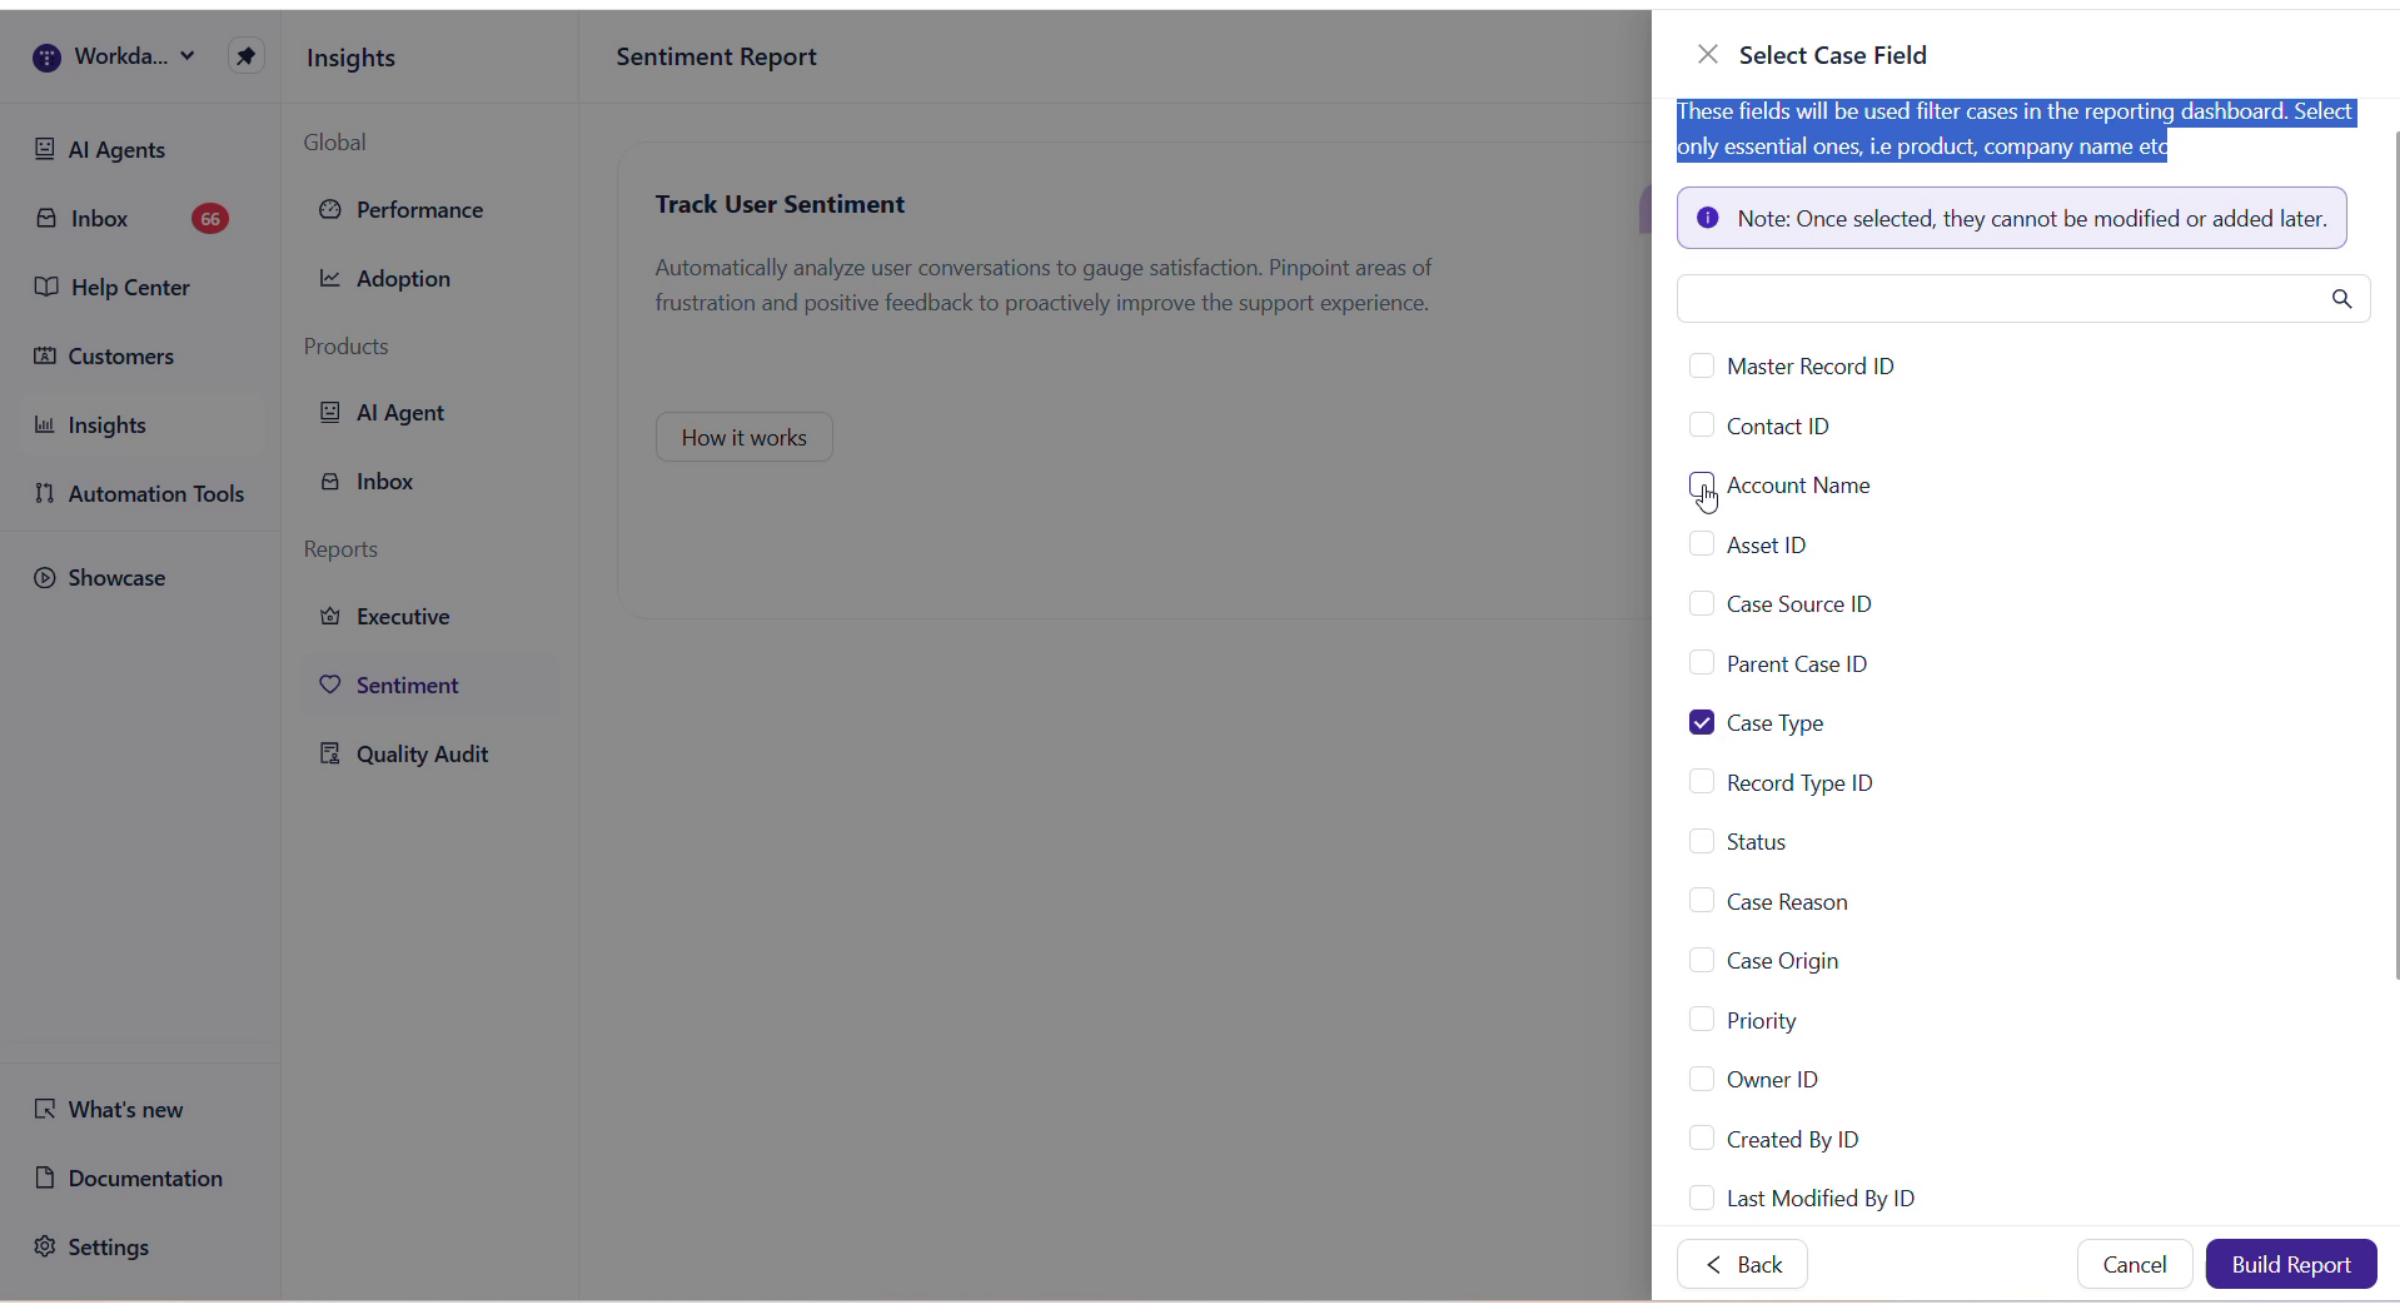
⚠️ Important: Once you confirm these field selections, they cannot be changed. Plan carefully before proceeding.
Step 6: Wait for report to build
You'll see a "Building..." status message.
Report building typically takes 2–5 minutes depending on the number of cases.
You can leave this page and return later. You'll receive a notification when the report is ready.
Once complete, the report appears in your Sentiment Reports list and is ready to view.
Create a Historical Sentiment Report
Historical reports analyze sentiment for a specific past period. Use them for deeper trend analysis and comparative studies.
Steps 1–5 are identical to Live Reports (report name, description, helpdesk platform, SOQL query, field selection).
The only difference is the report type selection: choose Historical Report instead of Live Report in Step 1 of the creation wizard.
When you create a historical report, Enjo analyzes all cases matching your SOQL query within the date range you specify during the viewing/configuration phase.
View and Analyze Sentiment Reports
Report Dashboard Overview
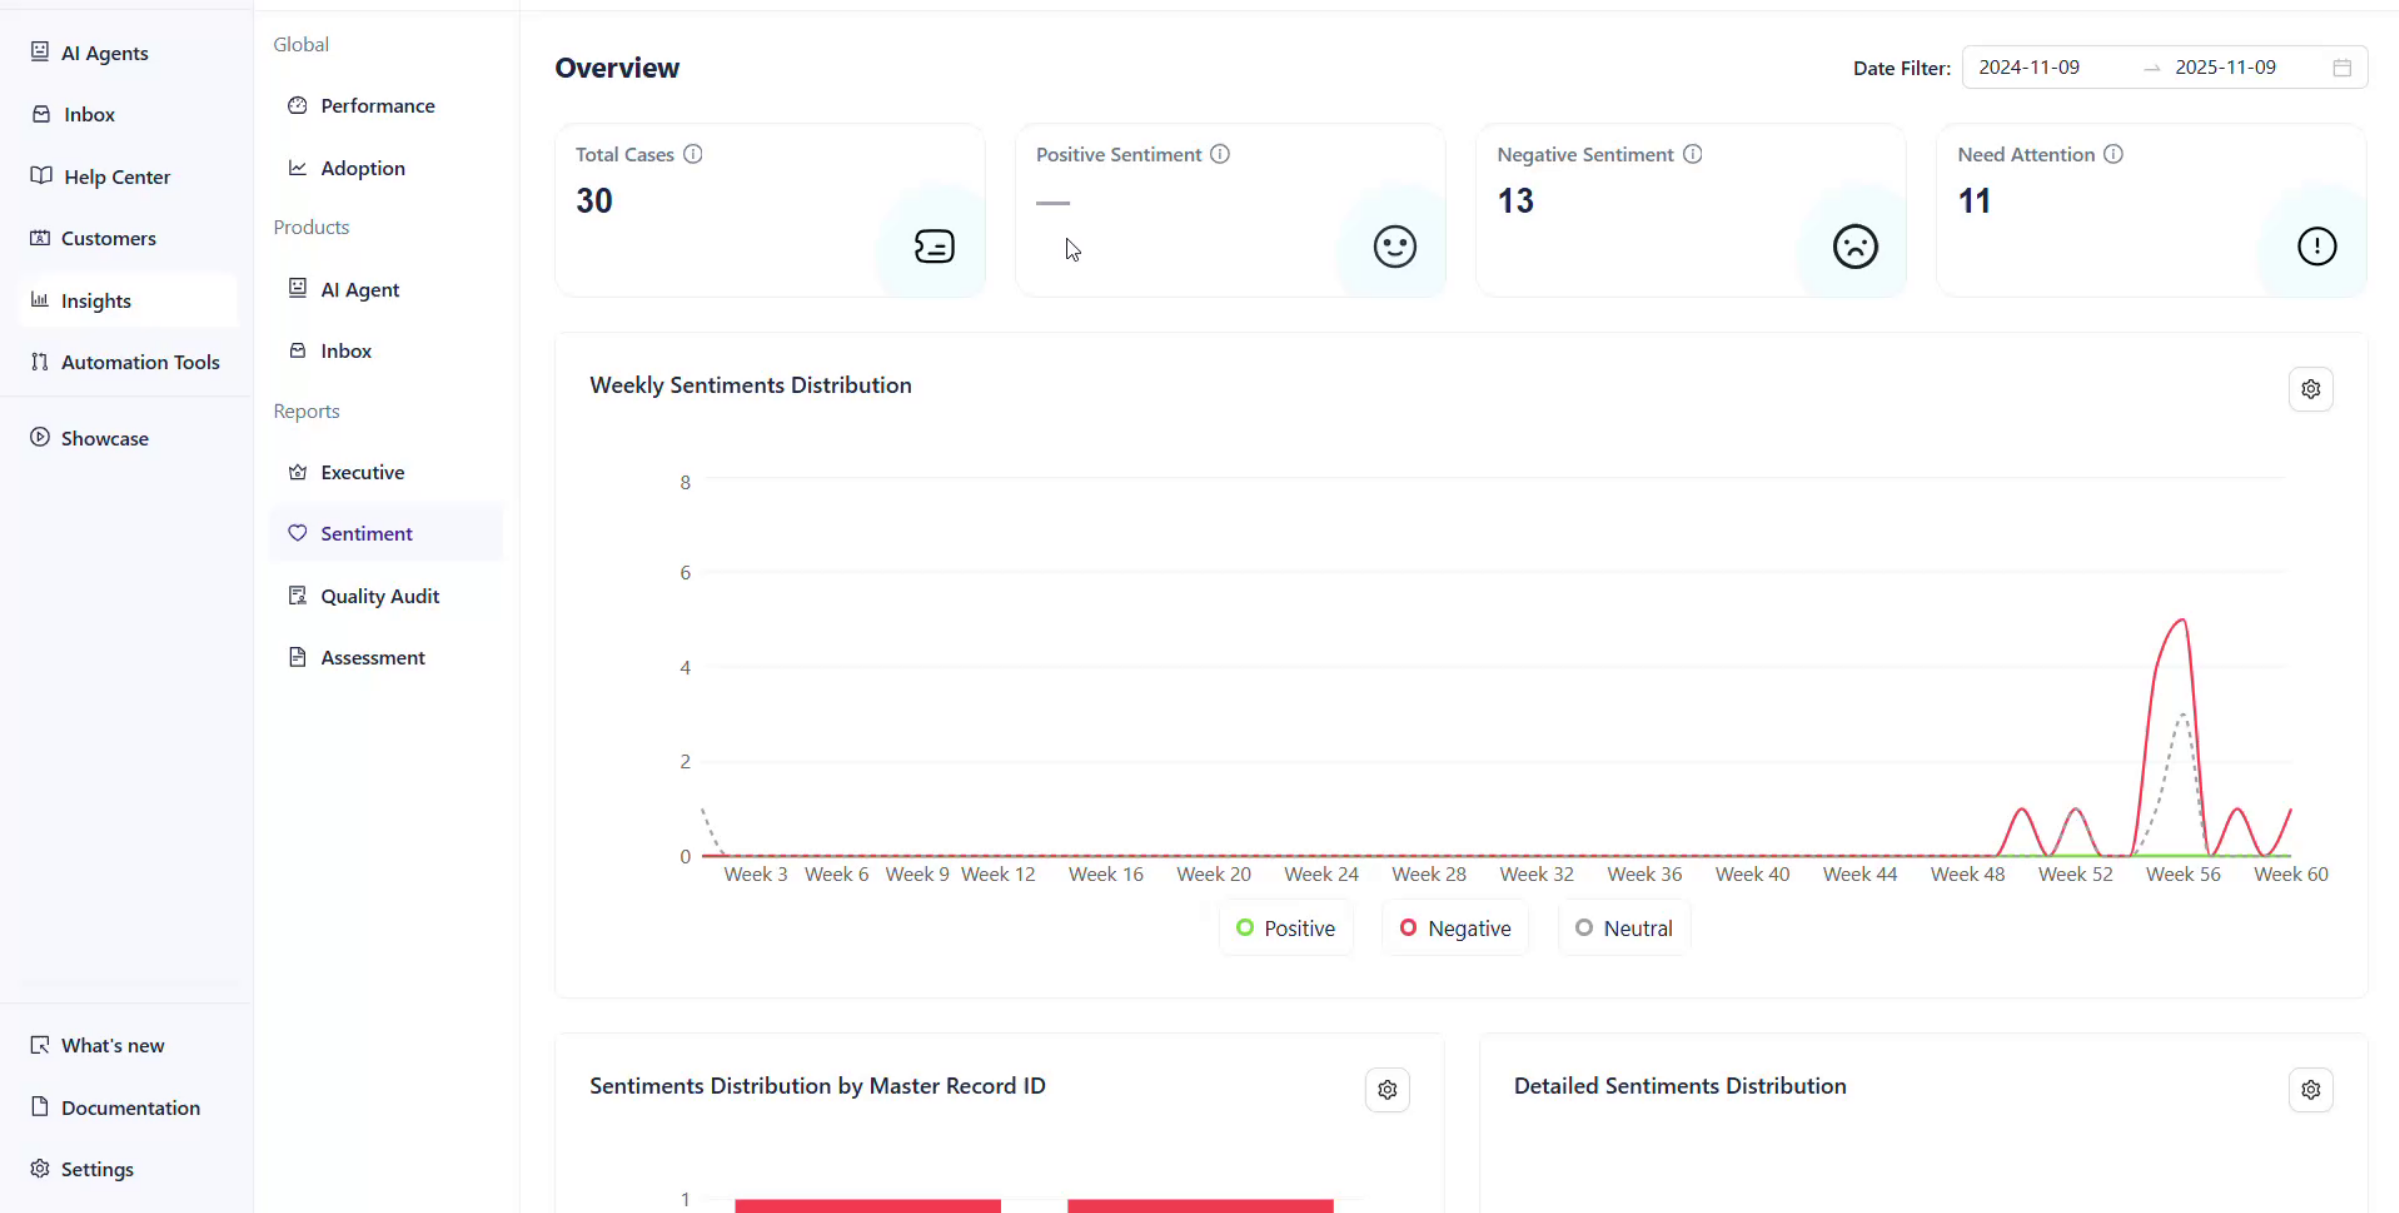
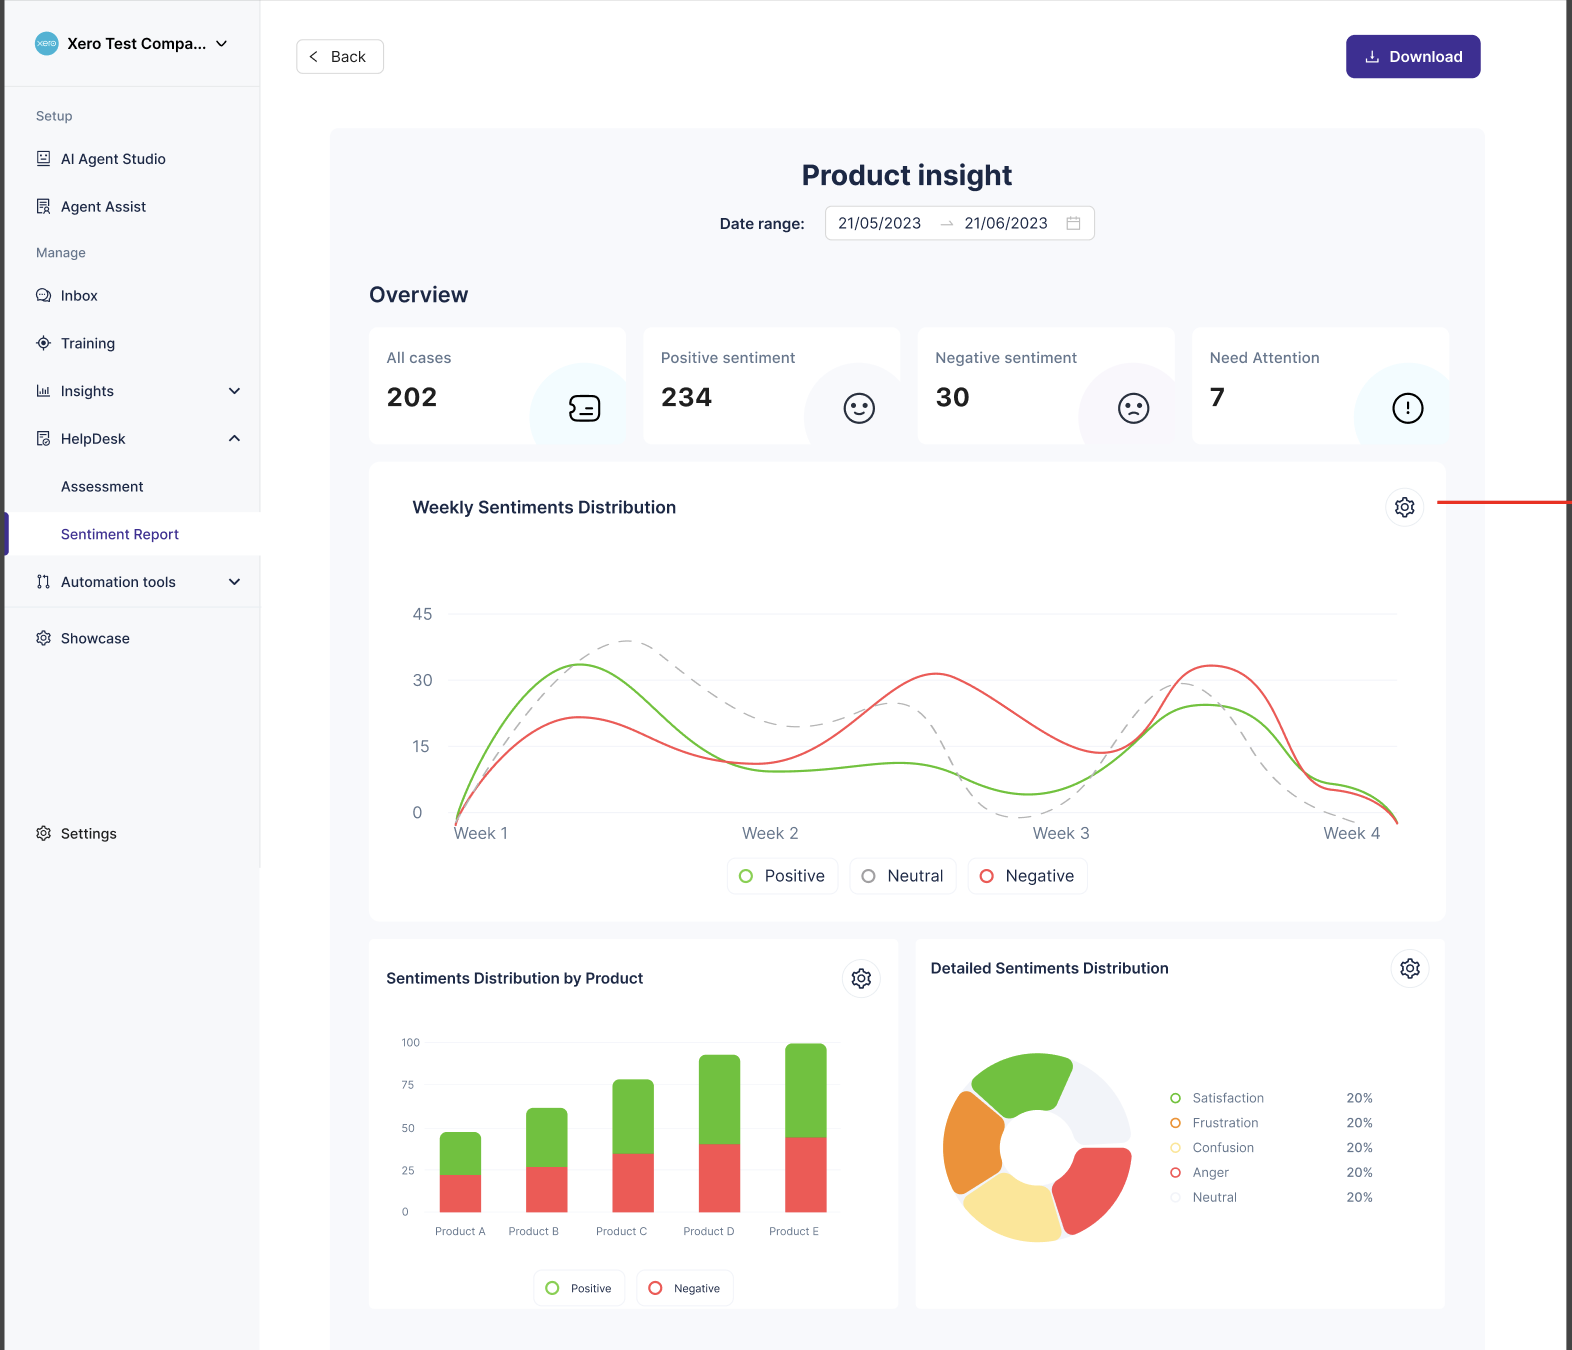
Once your report is built, the dashboard displays:
Overview Section (top cards):
Total Cases — Count of cases included in the report
Positive Sentiment — Number and percentage of cases with positive sentiment
Negative Sentiment — Number and percentage of cases with negative sentiment
Need Attention — Number of cases flagged for immediate action
Sentiment Tabs (below overview):
All Sentiments — All cases in the report
Positive — Cases with positive sentiment only
Negative — Cases with negative sentiment only
Need Attention — Cases requiring immediate action
Click any tab to filter the case list below.
Weekly Sentiments Distribution Chart
This line chart shows sentiment trends over time (week by week). You can see:
When negative sentiment spiked (frustration peaks)
Overall positive/negative balance over the period
Trends (improving or declining sentiment)
Hover over the chart to see exact numbers for any week.
Detailed Sentiments Distribution (by Master Record ID)
This section breaks down sentiment by category (e.g., product, service area, or team).
Examples:
"Mechanical" = 65% negative, 35% positive
"Electrical" = 20% negative, 80% positive
Use this to identify which areas are causing the most dissatisfaction.
Case List with Sentiment Details
Below the charts, you see a table with individual cases:
Case Name — Ticket title or ID
Case ID — Unique identifier
Status — Current case status (Open, Closed, etc.)
Reporter — Customer or agent who reported the issue
Sentiment — Positive, Negative, Neutral, or Need Attention badge
Click View Case to open the case in your helpdesk platform for deeper investigation.
Apply Filters and Date Ranges
You don't need to recreate the report to apply different filters. The dashboard allows dynamic filtering:
Click the Date Filter button (top right of dashboard).
A calendar appears. Select a custom date range.
Use the filter dropdowns for any fields you selected during report creation.
Example: Filter by Status = "Open" or Priority = "High".
Enter text in the Search field to find specific cases or keywords.
Click Apply to update the dashboard with your selected filters.
The report data updates instantly to show only cases matching your filters.
Export Report Data
You can download sentiment data in Excel or PDF format for sharing with stakeholders.
Click Export (top right of dashboard).
Export options appear.
Choose your format: PDF or Excel.
PDF: Formatted report with charts and summary
Excel: Raw data for further analysis
Click Download.
Depending on the report size, the file is either downloaded immediately or emailed to your registered email address (for large reports).
The file contains:
Overview metrics (total cases, sentiment counts)
Case-level details (case ID, sentiment, status, etc.)
Charts and visualizations
Best practices
Create focused reports — Don't include all cases. Use your SOQL query to focus on a specific product, team, or customer segment. Focused reports reveal insights that broad reports hide.
Review sentiment regularly — Schedule weekly reviews of live reports to catch emerging issues early. Don't wait for problems to escalate.
Drill down from trends — If a weekly chart shows a negative sentiment spike, use the filters to find which cases caused it and why.
Compare over time — Create multiple historical reports for different periods (e.g., Q1 vs. Q2) to measure improvement.
Share insights with teams — Export and share reports with support teams to show impact of changes (new documentation, process improvements, etc.).
Monitor "Need Attention" cases — These are highest priority. Investigate them immediately and understand what triggered the flag.
Use Master Record ID breakdowns — Identify problem areas or products causing the most frustration, then allocate resources accordingly.
Avoid over-filtering during creation — Keep your SOQL query broad enough to capture meaningful patterns, but specific enough to be actionable.
What's next
Adoption — Get started with Enjo and onboard your team
Executive Insights — Analyze ROI and business impact of your AI Agent
Help Desk Assessment — Identify automation opportunities from your ticket history
Feedback — Capture and analyze user feedback to improve your Help Center